These conditions give ranchers an incentive to build back their herds, but caution should be taken to avoid overloading forage systems with too many cow numbers.

“Developing a forage management plan for herd rebuilding” was one the pertinent topics discussed during 2015 Cattlemen’s College, a part of the Cattle Industry Convention and NCBA Trade Show held Feb. 4-7 in San Antonio, Texas.
The discussion was led by Dr. F.T. McCollum III, Texas A&M AgriLife Extension Service.
Due to the large amount of information delivered by Dr. McCollum, his presentation is recapped in two parts. The first part of developing a forage management plan is to determine forage needs, which is discussed in this article.
The second part, “Designing a forage production calendar,” will be presented in the June issue of Progressive Cattleman.
Production plan
“The first step in determining forage needs is to assess ranch resources and write a production plan based on the resource inventory,” said McCollum. “There are four considerations to aid decisions in writing a production program:
- What is the objective for rebuilding or expansion? How many animal numbers will be involved? Will the ranch remain a cow-calf operation or will yearlings become a second enterprise?
- What resources are available on the ranch? Resources include labor, expertise, water, equipment, facilities, current forage production and available finances.
- What are the grazing needs? If there is grass and the intention is to rebuild the herd only to the number of cows prior to the drought, grazing needs may be met.
- How to adapt current grazing resources or land to fulfill objectives? Is there land that can be diverted to beef cattle from other uses such as crop production or another forage type?”
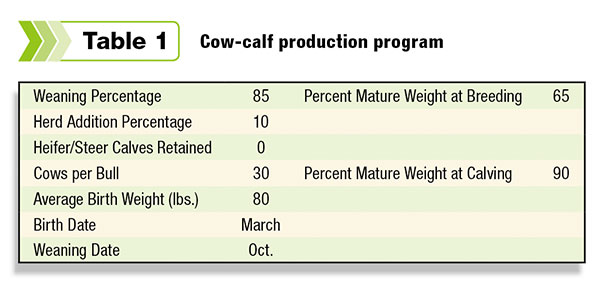 The written production plan should contain information similar to that shown as an example in Table 1. A production plan shows how cattle will be managed and the expected results.
Management decisions on how many heifers will be kept for herd replacements and how many steers will be retained as stockers are shown in the plan. It also shows the number of herd replacements to be purchased, number of cows per bull, calf birth dates and weaning dates.
Production results to include in Table 1 are expected birthweights, weaning weights and percentages, and percent mature weights at breeding and at calving.
Hopefully, animal weights can be obtained from herd production history. It is important to weigh cattle during various periods within their production cycles so their performance can be measured.
If the size of the operation cannot support the purchase of livestock scales, explore the possibilities of borrowing or renting a portable unit. Scales for weighing newborn calves are inexpensive purchases.
If animal weights have not been previously recorded, Standard Performance Analysis (SPA) numbers for your area can be used as estimates to start the planning process.
SPA was initiated by the NCBA with the objective of analyzing production data supplied by cow-calf producers. The analysis provides production measurement averages as a guide for producers to use in the improvement of their management practices.
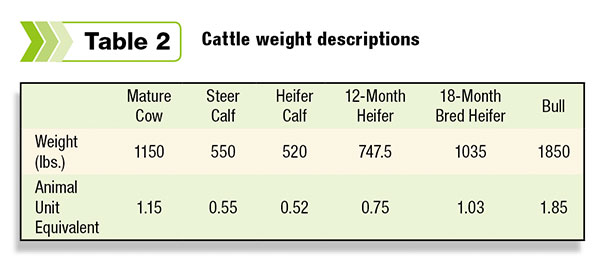 The importance of cattle weights are again highlighted by the examples in Table 2. Animal numbers are presented in Table 1, and average weights for each age group are listed in Table 2.
Animal weights are important for calculating forage needs. Weights in Table 2 are for average-sized beef animals in today’s industry. If possible, average weights should be used from the herd for which the forage management plan is written.
“As shown in Table 2, cattle weights are converted to animal unit equivalents,” McCollum explained. “An animal unit (AU) is normally defined as one mature cow weighing about 1,000 pounds and her suckling calf, or an animal with a monthly requirement of 780 pounds of air-dried forage.
AU equivalents in Table 2 were derived by dividing the animal’s weight by 1,000. Animal unit equivalents are the units used to calculate forage demand and production.”
Stock flow plan
A stock flow plan is developed from the animal numbers listed in the production plan. In developing a stock flow plan, a cow is considered the basic animal unit, and bull and calf numbers are allocated among the cows.
Click here or on the image above to view it at full size in a new window. (PDF 640 KB)
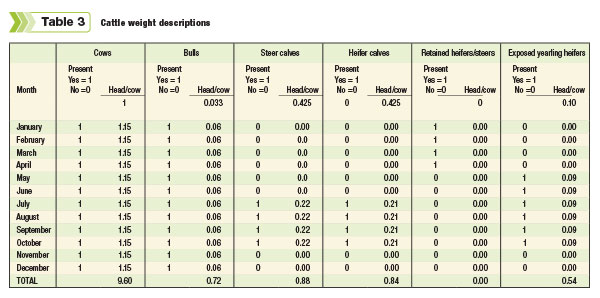
For instance, as shown in Table 3, the bull contributes 0.033 head. This figure is obtained by:
1 bull ÷ 30 cows = 0.033 head per cow
A heifer and steer calf each contributes 0.425 head. This figure is obtained in the following way:
85 percent weaned calf crop = 0.85 calves per cow
Calf crop is 50 percent heifers and 50 percent bulls/steers
0.85 calves per cow x 0.50 = 0.425 heifers and 0.425 steers per cow
The annual replacement rate is 10 percent, so there will be 0.10 exposed heifers present for each mature cow. Allocation of these heifers to one cow, as shown in Table 3, is calculated by:
159 cows x 0.10 annual herd addition percentage = 16 heifers which contribute 0.10 head to one cow
The numbers listed for each month of the year in Table 3 are the animal unit equivalents allocated to one cow.
These figures are obtained by multiplying the contribution by head times the animal unit equivalent listed in Table 2 for that particular class of livestock.
Table 3 also shows the months that the different classes of livestock are on pasture and consuming forage. The cow and bull are on the ranch somewhere year-round and need forage continually through the year.
As the data in Table 1 show, calves are born in March and begin consuming significant amounts of forage in July. They are weaned in October and sold.
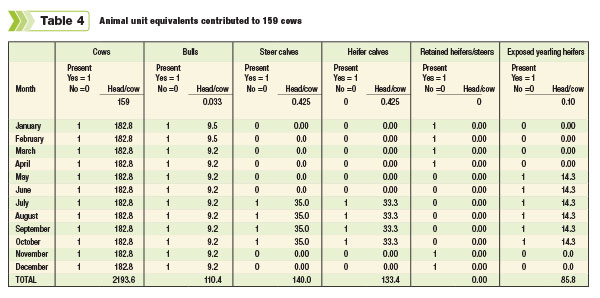
“A herd of 159 cows is used in this example,” McCollum continues.
Click here or on the image above to view it at full size in a new window. (PDF 864 KB)
“Table 4 shows animal unit equivalents expanded for the entire herd of 159 cows. These figures are obtained by simply multiplying the animal unit equivalents in Table 3 by 159."
Click here or on the image above to view it at full size in a new window. (PDF 227 KB)
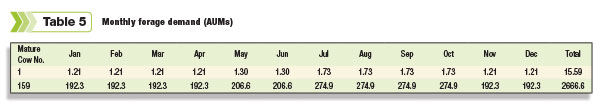
Total animal units are calculated for each month in Tables 3 and 4 and are entered in Table 5.
The totals are animal unit months (AUM), which is the amount of forage required by an animal unit for one month.”
We now have determined the stock flow and their AUM forage requirements. The next step is to design a forage production calendar, which will be demonstrated in the June article. ![]()
Robert Fears is a freelance writer based in Texas.