It’s no secret that agricultural costs climbed through 2021. Nitrogen is twice as expensive as it was last year, natural gas is about 50% more expensive than this time last year and the price of gasoline more than doubled as well.

Unfortunately for beef producers, the price of feed ingredients is up, too. The December 2021 corn contract has risen 40% since last November, the November 2021 soybean contract closed up 20% from this time last year, July 2022’s wheat contract is up 57% and the December 2021 cotton contract is up a whopping 71%. At the same time, we’ve seen a major drought limit the supply of hay for the upcoming year, leading to higher hay prices. All of this means that we expect a few key costs in producing cattle to increase compared to last year.
With so many price movements, you may be wondering if supplemental feeding will be profitable – in other words, where should you cut costs? We can use my usual economic go-to (marginal revenue versus marginal costs) to form a picture of results from trying different strategies.
Breaking it down
By combining dried distillers grains cost and the cost of cottonseed, I estimated a rough average supplementation cost that rose about 31% year over year, from 17 cents per pound to 22 cents per pound. From 2020 to 2021, the average price of non-alfalfa hay on the Texas High Plains also rose, about 29%, from about $140 per ton to about $180 per ton. Using these changes and the calf price, we can evaluate changes in revenue against changes in cost of feeding.
We will use our 2022 Amarillo Texas A&M AgriLife Extension Winter Stocker Budget with an expected sale price of $164 per hundredweight (cwt) for 600-pound stocker calves (up 5.8% from 2021). This budget assumes a base average daily gain (ADG) of 1.75 pounds over 120 days, which includes 200 pounds of hay per head and 15 pounds of mineral per head. I’ve adjusted the budgets to include a hypothetical supplement ration fed at a rate of 2.5 pounds per head per day for a total of 300 pounds per head. (Note that I do not necessarily intend to represent any one type of supplement or specific item, only the expected per-unit costs, volume fed and hypothetical gains.)
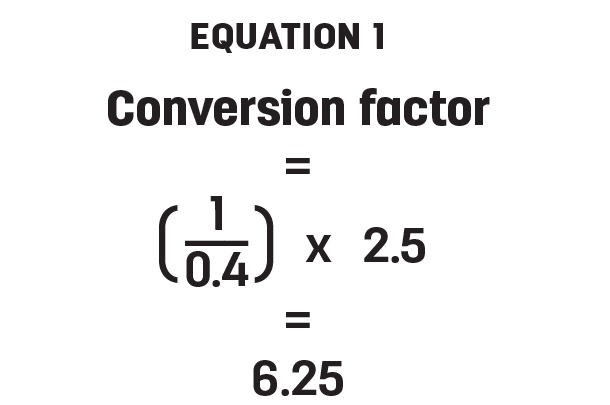
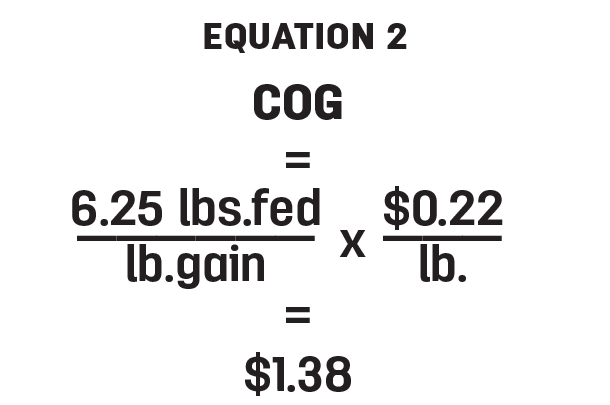
For the purposes of this base scenario, I’ve assumed that the hypothetical supplement increases ADG by 0.4 pounds per day. Using these figures, we get a conversion factor (pounds of feed divided by pounds of gain) of 6.25 pounds (see Equation 1), and therefore, a cost per additional pound of gain (dollars per pound of gain) (COG) from supplementation equaling $1.38 (see Equation 2).
First, holding costs to last year’s levels in the first column in Table 1, we can see that the expected break-even price for calves would be about $156.73 per cwt.
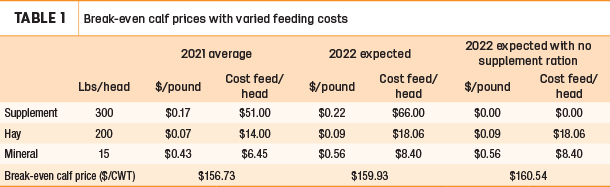
By increasing hay, supplement, and mineral cost by the previously discussed amounts, we find that break-even price for calves increases to $159.93 per cwt.
Considering only those two figures, you might think that supplementation at the new higher prices isn’t worth the cost. Both break-even prices are below the expected calf price of $164 per cwt, but higher feeding costs this year appear to eliminate approximately $3.20 per cwt net return year over year. However, looking at the third column in which no supplementation is provided, the break-even price has gone up, meaning that by not supplementing with the hypothetical ration, our cost per pound of production has gone up. The lost value of gain is more expensive than the cost of supplementing with the hypothetical ration.
Cost of gain
The easiest way to think about it is that the percentage increase in total gain from including the ration (7.9%) exceeded the percentage increase in the total cost of gain (COG) when including the ration (7.4%), even though this year’s costs have increased. This is because, even with feed costs up significantly, they still only make up about 9% of the total cost of production in this scenario. The need to supplement more or to feed more hay (perhaps due to drought) will change this calculus, and the greater the volume of supplemental feed you must provide, the faster the cost increase will impact your budget.
If we hold supplement purchase cost stable in Table 2, the variable to focus on is the conversion rate, the ratio of pounds of feed to pounds of additional gain from that feed.
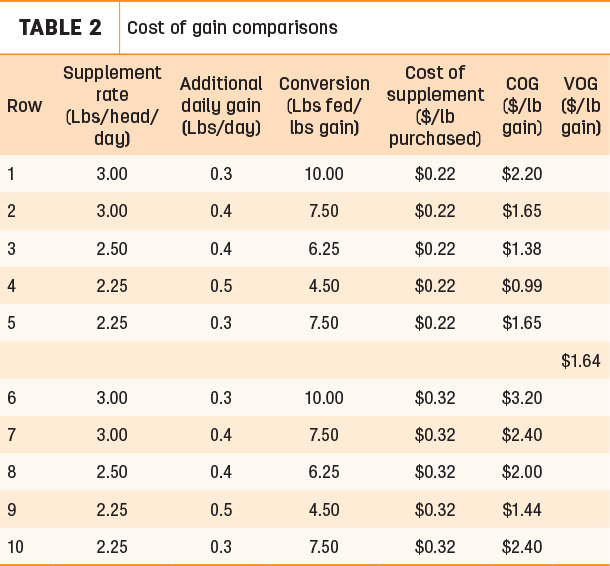
Looking at rows 3 and 5, we find that feeding less doesn’t necessarily mean you are spending your input dollars at their highest and best use. The value of additional gain per day in row 3 (an increase of about 22%) outpaces the cost of the saved quarter-pound of supplement in row 5 because of a better conversion factor. The COG in row 5 is higher than the break-even value of gain and higher than the cost in row 3. For this set of hypothetical circumstances, 7.4-to-1 is approximately the break-even conversion rate if supplement costs are 22 cents per pound purchased.
It’s also important to remember that a lower cost input doesn’t necessarily mean a more profitable outcome. Consider row 5 and row 9. Though feeding the same amount, the better conversion factor in row 9 leads, once again, to a lower COG and therefore a more profitable net outcome. Row 5’s COG is higher than the break-even value of gain and higher than row 9’s COG.
This example is extremely distilled, and conversion is difficult to calculate in real time. My animal science colleagues remind me that not all animals respond with the expected gain from supplementation, and conversion can even fluctuate for the same animal during a grazing period, and it is important to always consider animal welfare and appropriate animal husbandry practices before severe cost cutting.
However, this is where I get to harp on the value of collecting and using your own data over time (and working with your extension specialists). If you have a record of the way your system normally works, even if you don’t get a point estimate on the returns to supplementation, you can develop a range, which is still incredibly valuable.
For example, even though supplementation prices are up 30% this year, we’ve established that in this scenario any supplement that costs about a quarter per pound purchased with a conversion factor of 7.4-to-1 or less will yield an expected net profit. You can also use these methods to evaluate other costs like more expensive hay and the net returns to a preconditioning program.
If you have no idea what the remainder of your cost of production is, then these decisions are even more difficult to make. If you’re just starting data collection, you can find PDF and spreadsheet versions of the budgets I used at Amarillo Texas A&M. You can find data on supplement prices at University of Missouri’s byproduct website. Finally, Dr. Jason Smith, extension beef specialist at Texas A&M AgriLife, and I have developed a Supplemental Feedstuff Cost and Value Calculator that will help you evaluate these decisions for yourself.
Justin Benavidez
- Assistant Professor
- Texas A & M AgriLife Extension
- Economist
- Email Justin Benavidez