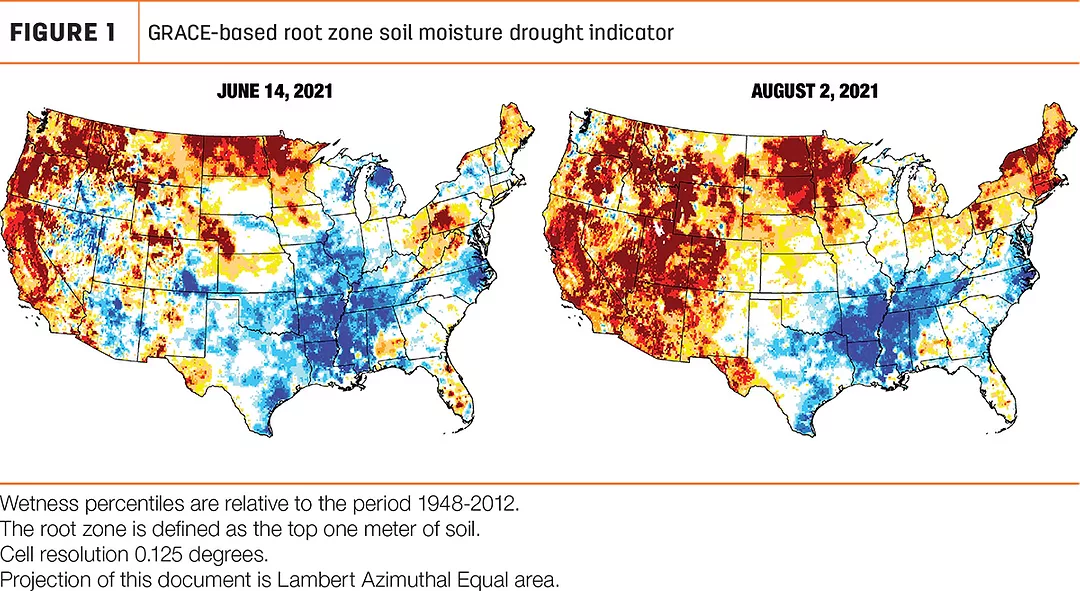
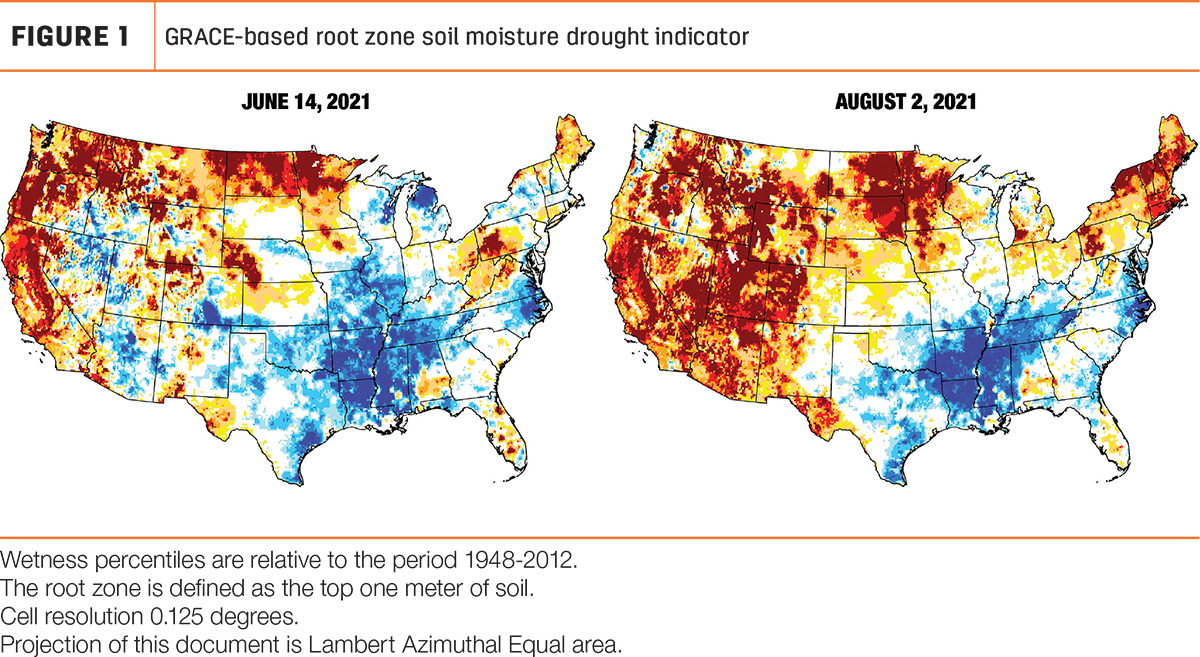
Predicting feed costs for 2022-23 is like predicting weather in July and August. Feed costs will be influenced by moisture conditions, degree days, delayed planting and delayed harvesting of legume/grass forages. Varying moisture conditions exist in the U.S. when looking at the drought maps in July (Figure 1).

Dairy farmers cannot control factors listed below that will impact their future feed costs. These factors were relevant when this article was submitted in July 2022 and change on a daily basis.
- Inflation has raised the cost of most dairy farm inputs, including feed costs.
- The risk of a recession can reduce the world purchases of dairy products, putting more pressure on profit margins while reviewing ways to lower feed costs.
- The war in Ukraine has reduced grain exports, raised grain prices and increased fertilizer costs.
- The corn futures in July 2022 were $7.63 a bushel, $6.86 in December 2022 and $6.90 a bushel in May 2023. Acreage allocation and weather in the U.S. and Brazil will change these future prices.
- Soybean meal was listed at $432 a ton in July, $402 in September and $397 a ton in December 2022.
- Corn was curling in central Illinois. Crop scientists from the University of Illinois indicated early planted corn when rolling up may experience more yield reduction due to less photosynthesis. Late-planted corn had less surface area, leading to less potential losses. Some hybrids are more heat-tolerant; monitor this response for future seed selection.
- Timely moisture events will be important in July when corn pollination occurs and later in August when corn kernel filling occurs, increasing starch levels.
- Legume and grass yields are impacted by moisture conditions and fertility, realizing that fertilizer costs have been high.
- Pasture availability varies greatly depending on weather conditions.
Strategies to optimize or control feed costs
Option 1: Knowing your feed costs will be key when evaluating rations (Table 1). Compare your input costs to other farms in your region to determine if opportunities exist.
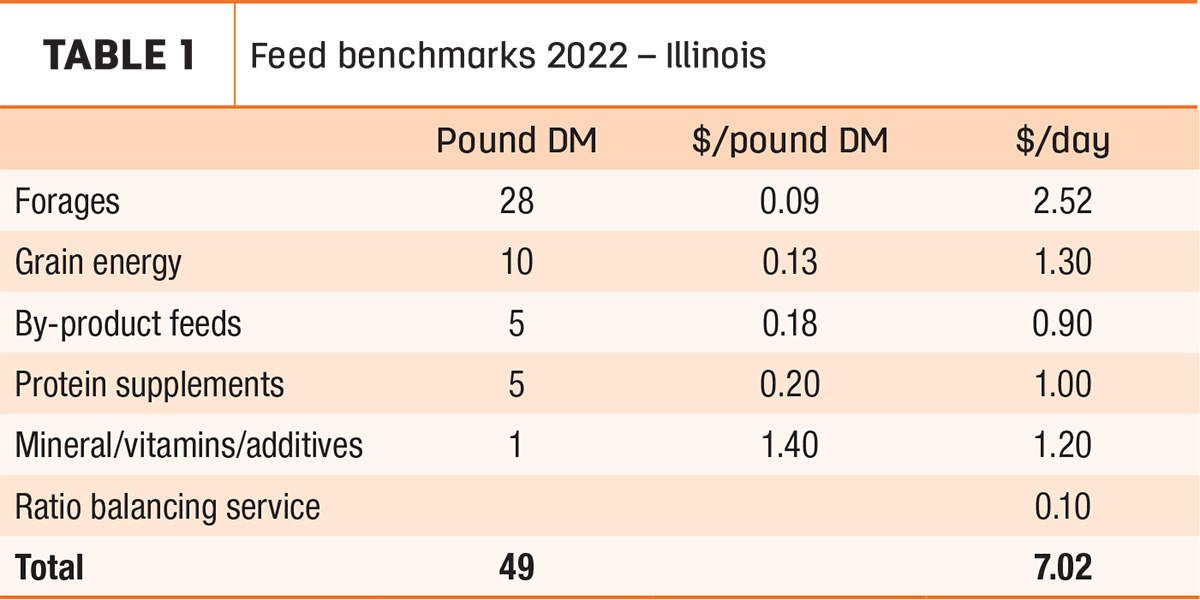 All feeds were entered at market price, not the cost of production. In Table 1, 67% of the forage dry matter was corn silage, with 33% from legume/grass/small-grain sources (could be hay, haylage, baleage or pasture) on a dry matter basis. Corn silage is below breakeven costs when using Sesame software from Ohio State University (current price as $55 a wet ton compared to breakeven price of $106 a wet ton at 35% dry matter). With legume hay at $225 a ton, this price was below breakeven price calculated at $266 a ton.
Both forages represent “good buys” based on current market prices. In the byproduct category in Table 1, half is corn gluten feed (a bargain in the Midwest with a spread of $26 below breakeven price) and half fuzzy cottonseed ($40 above breakeven but brings functional fiber and fat to the ration). The protein source is half 48% soybean meal (close to breakeven) and half corn distillers grain (a bargain feed ingredient with a margin of $39 a ton below breakeven price). Other regions in the U.S. may have “bargain feeds” including hominy, canola, citrus pulp, beet pulp and/or almond hulls.
Option 2: Forage quality and quantity can be important, as these forage ingredients can lower ration costs if high forage quality was achieved. Corn silage can reduce the amount of expensive corn grain (shelled corn) and soybean meal (substituting legume/grass forage). Forage quality measurements are listed below (fine-tune and adjust these for your dairy farm or clients). The NDFD-30 (neutral detergent fiber digestibility at 30 hours) values are expressed as a percent of NDF while uND-240F (undigested neutral detergent fiber at 240 hours) are expressed as a percent of the forage dry matter.
- Corn silage: Starch over 30%, under 35% NDF, NDFD-30 over 60% (BMR or brown midrib lower-lignin corn silage over 65% NDFD).
- Legume forage: Crude protein (CP) over 20%, NDF under 40%, ADF below 30%, NDFD-30 and relative forage quality (RFQ) index over 160.
- Grass and small-grain forages: CP over 14%, NDF under 45%, NDFD-30 over 55% and RFQ over 150.
- Filler forage (dry cows and older heifers): Over 6% CP, NDF over 55% and NDFD-30 under 40% are typical analysis for straw, cornstalks and low-quality legume-grass forages.
The dairy farm must have adequate inventory to meet the annual needs for each class of dairy cattle on the farm. Fall corn silage harvest, CRP-released acreage and fall small-grain forage (such as oat forage) can be used to meet forage inventories as needed. Nutritionists need to consider the ratio of each forage for different classes of dairy animals. For example, for high-producing cows’ forage needs, 60% to 70% corn silage and 30% to 40% legume, grass or small-grain forage on a dry matter basis can be optimal for lower feed costs and high milk production. Forage dry cows can be fed 50% filler forage and 50% corn silage on a dry matter basis, resulting in a low-energy diet to control weight gain.
Option 3: Processing feed ingredients for optimal rumen fermentation, rate of feed passage, small-intestine enzymatic digestion and capture nutrients needed by the cow leads to higher milk performance. Optimal grain particle size and corn silage processing can lower fecal starch levels (under 3% with top herds under 1%), saving on adding corn grain. A corn silage kernel processing score over 70% is optimal, with top producers achieving over 75%. One guideline is no whole or partial kernels in the corn silage at the time of harvest, especially if the dry matter content of the corn silage is over 35% dry matter due to drought, harder kernels or delayed harvest. Set rollers to 1- to 2-millimeter gap between rollers, which will require adding power, fuel and chopping time. Check forage particle length for optimal rate of feed passage, DMI at the feedbunk and rumen health using the Penn State particle box (Table 2). No particles in the top box (19 millimeters) should be over 1 inch to minimize sorting and improve feed intake at the bunk. Typical field chopper settings are listed below.
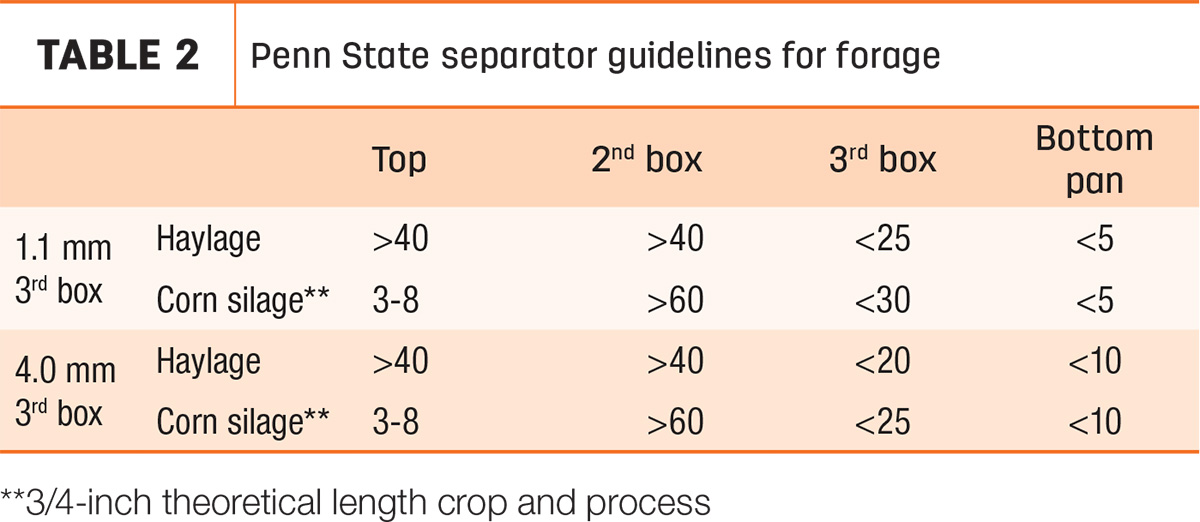
- Corn silage: 3/4-inch theoretical length of chop (TLC) with a kernel processer (shorter for drier corn silage to allow for optimal packing). Without a kernel processor, set at 1/4- to 1/2-inch TLC.
- Legume, grass and small-grain forages: 3/8- to 1/2-inch TLC.
Option 4: Use milk production data when evaluating forage choices in rations. Strategies should maintain milk production and components when making changes in 2022-23 rations. Do not sacrifice production and profits when reviewing feed costs and strategies.
- Milk urea nitrogen (MUN) is a useful tool to determine if rumen microbes capture rumen-degraded protein (RDP). Target MUN levels range from 8 to 12 milligrams per deciliter with top herds achieving 8 to 10 milligrams per deciliter. NASEM 2021 guidelines recommend 10% RDP of the ration dry matter for optimal rumen ammonia levels for rumen microbes. Carbohydrate level and balance (sugar and starch) will impact MUN levels.
- Milk components add to the bottom line. Milkfat should be over 3.9% and 3.1% true protein for Holstein herds. Milk components are valuable at $3.33 per pound of milkfat and $3.42 a pound for true protein (June 2022 prices).
Take-home message
Evaluate forage inventory and needs for 2022-23 now. If more forage is needed due to shifting to a higher forage-based ration, plan where you harvest this inventory. Forage quality, forage processing and maintaining milk production will be important.