


Several months ago, I wrote an article discussing the relationship between milk price and several economic factors to determine if there was a correlation between these economic indicators and the Class III milk price. This article is a follow-up to my last piece as I drill down further into some agricultural factors and prices to see if there are any better correlations and indicators of the upcoming milk price.
In short, the highlights from the last article were that disposable personal income had the highest correlation with the Class III milk price, and that the 2008-2009 world economic crisis had a significant impact on all the financial factors that were studied, including the milk price.
As a reminder, I used the Class III milk price because it is relatable to most of the country and highly correlated to milk prices throughout the country, including California. Table 1 shows the correlations for the factors examined in the previous article. The closer the correlation is to 1.00 or -1.00, the higher the correlation.
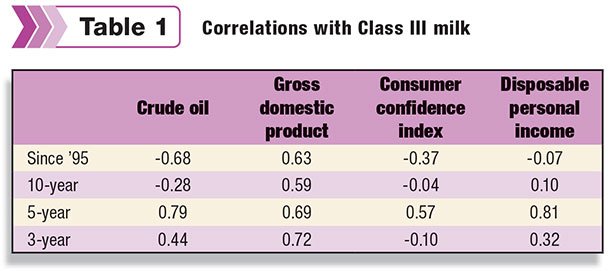
As a follow-up from the last article, I wanted to know if the crude oil price, gross domestic product, consumer confidence index or disposable personal income were a leading indicator of the milk price. In order to do so, I adjusted the timeline for the correlations to see if the financial factors were a leading indicator of the milk price.
I took the correlations between the milk price and financial factors three, six and 12 months ahead of the milk price. For example, for the three-year correlation between the crude oil price and the Class III milk price, I used the milk prices for 2012, 2013 and 2014, and the crude oil prices for 2011, 2012 and 2013.
Unfortunately, the time-lag analysis provided little improvement to the correlations and little improvement to milk price indication.
So next I asked, are there better correlations and indicators?
After reviewing financial factors, I then turned back to several agricultural factors to see if I can find a better indicator for the milk price.
Corn price
Many people think milk prices and feed prices move together. First, letâs look at the corn price. Figure 1 shows that there are many times when the corn price and the Class III milk price moved in conjunction, but also many times when they moved in opposite directions.
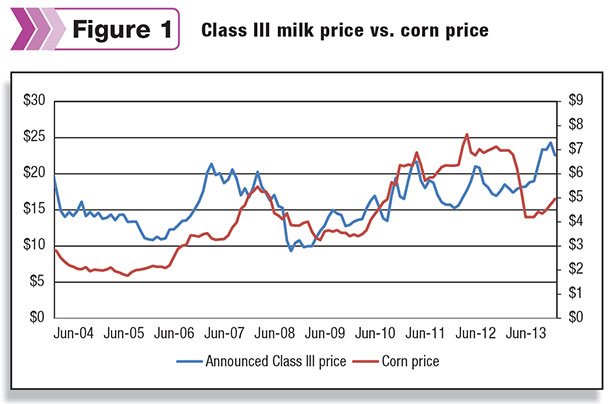
The correlations for the three-year and five-year time frames were both just under 0.5 (close to 1 or -1 indicates a high level of correlation). I also adjusted both the three-year and five-year correlations to see if the corn price was a leading indicator of the milk price.
By adjusting the time-lag to three, six and 12 months, the correlations changed very little (highest correlation was less than 0.6), and still no significant pattern was determined.
Soybean meal price
Following up on the feed-to-milk price relationship, I looked at the soybean meal price relative to the Class III milk price. It was a similar story to the corn price relationship â there were times when the prices moved together, but unfortunately also times when the markets did not.
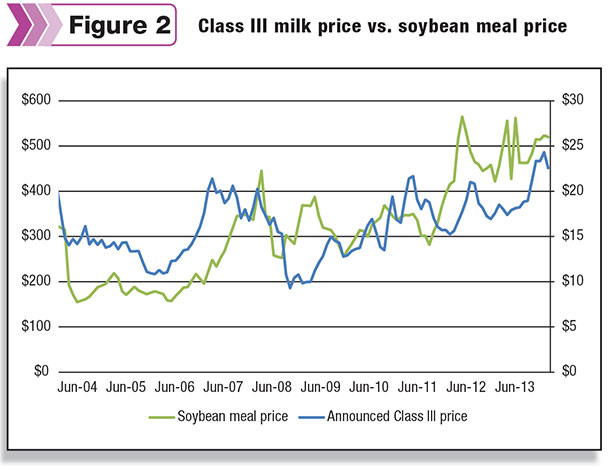
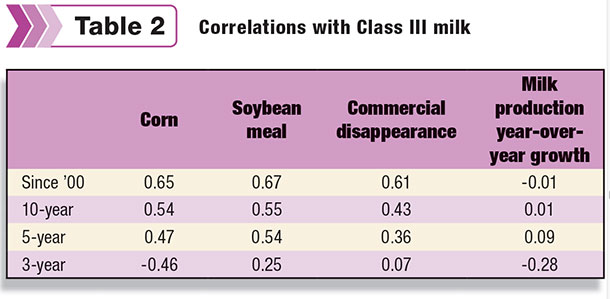
The three-year and five-year correlations are even lower than the corn price-to-milk price correlations, and once again, a time lag did little to improve the relationship.
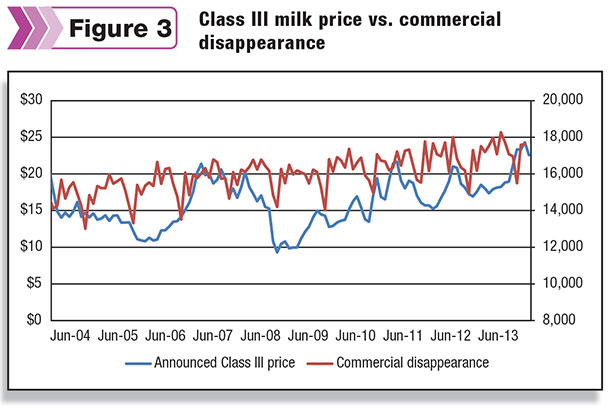
Commercial disappearance
Switching gears a little, I looked at total commercial disappearance of milk in all products compared to the Class III milk price. This figure is a little harder to look at because of its seasonality, but there are some noticeable deviations on the commercial disappearance line.
The most noticeable aspect is that the commercial disappearance has been steadily increasing and so has the milk price in recent years. The correlations here are pretty weak, and adjusting for any time lag does little to help improve the relationship.
The take-home message from Figure 3 is: The world is hungry for dairy products. Even as the price moves higher, commercial disappearance is able to keep up as consumers buy our products.
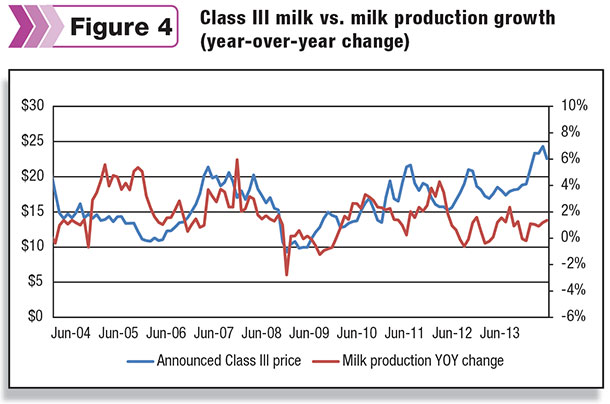
Milk production year-over-year change
Lastly, I looked at the year-over-year change in milk production versus the Class III milk price. Once again, there are times when the data lines up nicely and the two series move in conjunction and then other times when the data moves in opposite directions.
The correlations for milk production to Class III milk are the worst of the group, and while adding a time lag helps, the best correlation with the time lag is still only around 0.3.
In the last article, my summary statement was that the milk price is most dependent on the world economy, and this continues to be my synopsis. When the population has more money, they consume more dairy products. That is true for both the domestic population and the world population.
The agricultural factors examined in the article did little to help show that the milk price is driven by feed prices or even recent production changes. The feed prices and milk prices tend to move in the same direction, but because they are truly separate commodities, they are ultimately driven by various different factors that may or may not coincide.
And although we all understand that a big change in milk production (supply) will impact the supply-demand balance and ultimately the milk price, milk production growth has been relatively stable in recent years.
For more than two years, the year-over-year milk production growth has been between 0 and 2 percent. This mild production growth has been easily consumed by both the domestic and international markets. A word of caution is that if (some may say when) milk production takes a big move higher, we will see a turn in milk price.
We have been experiencing a historically high milk price for more than six months, and it is not a wild assumption to think that milk production will increase in the upcoming months. That increase in milk production could result in a supply-demand imbalance and decline in the milk price.
No one knows what the future will bring, and unfortunately the milk price is dependent on many factors. The world economy, feed prices and weather are just a few. I suggest producers take matters into their own hands and review their available risk management strategies to determine if one will help protect them and their business from future volatility. PD
Katie Krupa is a broker with Chicago-based Rice Dairy, a boutique brokerage firm offering guidance, analysis, and execution services on futures, options, spot and forward markets.
There is risk of loss trading commodity futures and options. Past results are not indicative of future results.

Katie Krupa
Broker
Rice Dairy


