Data is rapidly changing our world in all parts of our lives. Dairy is no exception to this phenomenon. A data revolution is underway in the dairy industry. We hear many buzzwords to describe this revolution: analytics, big data, precision dairy, business intelligence, internet of things.

Analytics is the discovery, interpretation and communication of meaningful patterns in data. Of course, we have been doing this in dairy for many years. What is different now is the availability of new sources of data, new techniques for analyzing data, new ways to visualize data, new metrics and new tools for summarizing data.
Data can be a source of competitive advantage and a means to uncover new solutions for improved profitability. Although a lot of the buzz for data in the last few years has been on new sources of data, tremendous untapped potential exists for looking at old data in new ways.
The sports world has been a model for demonstrating how analytics can be implemented successfully in this way. Analytics has changed the game for every sport. In sports, new statistics have been developed that look at old data in new ways. Let’s use three examples in basketball as examples.
- Effective field goal percentage adjusts a player’s field goal percentage accounting for the fact that three-point shots are worth more than two-point shots. Someone who shoots 33% from three-point range is equally efficient at scoring as someone that shoots 50% from two-point range. This statistic adjusts for every combination in between.
- Value-added calculates what a player adds to a team above what a replacement player would.
- Player efficiency rating is an overall rating of a player’s per-minute statistical production. It weights a series of old statistics like points, assists, rebounds, blocks and shooting percentages into an overall rating.
These statistics are now used to change game strategy and determine pay rates for players. For example, the Houston Rockets used analytics to identify that getting fouled while shooting a three-point shot is an extremely efficient way to score for players who shoot well from the free throw line. The Rockets’ James Harden has used that strategy to become the leader scorer in the NBA over the last couple of seasons.
Player efficiency rating helps identify players like Danny Green of the Los Angeles Lakers, who consistently ranks among the most efficient players in the game and gets compensated well for this. He isn’t the flashiest player, but he scores when it is needed, plays great defense, and he simply helps his team win more games.
We can do the same thing with dairy data. A metric like Money Corrected Milk, trademarked by Dairy Records Management Systems, is a revenue-based metric that considers not only how much milk each cow gives but also the economic value of that milk adjusted for the value of that cow’s milk adjusted for her fat and protein level. Retention pay-off is a metric that calculates the value of a cow’s future net revenues compared to her potential replacement.
At this point, we may not have a universally accepted overarching metric like player efficiency rating for dairy cows, but we will likely have some in the future. Wouldn’t it be nice if we had a metric that helped us quantify the economic contributions of a feed-efficient, high-component cow that never gets sick and breeds back in a timely manner. Just like in basketball, sometimes our normal statistics miss the value of those cows. But we all know those are the kinds of cows that make us the most money.
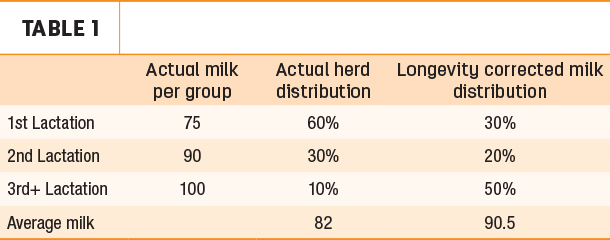
We will start to see novel metrics that provide new valuable insight into data. Longevity-corrected milk is a metric that can help us account for the impact keeping cows in the herd longer has on milk production. This metric is a weighted average of milk production per lactation group (first, second and third-plus) adjusted as if the herd were 30% first-lactation, 20% second-lactation and 50% third-plus. This shows what the milk production potential of the herd would be given current management if the herd was a bit older. Sometimes, we lose sight of how much more milk we can get by allowing cows to reach their mature milk production levels. The longevity-corrected milk example in Table 1 shows how a herd with an average milk production of 82 pounds would be milking over 90 pounds with an older herd.
Summer-to-winter ratios are another novel metric. They are a concept developed in Israel to quantify seasonal effects on cow performance. They can be used for multiple metrics, like milk yield, conception rate, somatic cell count and components. In the simplest form, they are calculated as summer performance variable to winter performance variable. The closer the ratio is to 1, the less seasonality in performance.
A ratio under 1 indicates reduced performance in summer compared to winter – except for SCC, where a number over 1 indicates reduced performance. For example, a herd with summer production of 80 pounds and winter production of 100 pounds would have a summer-to-winter ratio of 0.8, indicating a 20% reduction in milk production. A 2019 study recently summarized this with U.S. data in the Journal of Dairy Science, if you’re interested in learning more about this concept.
What other novel metrics are needed for the dairy industry? Novel metrics should be economically driven, practical and actionable. We need more metrics for better quantification of efficiency, culling, animal health, longevity and preventive strategies. We also need metrics that move beyond averages to effectively account for the importance of variation. This could be as simple as looking at percentages of animals below or above thresholds in addition to averages.
Averages can lie. An area where I often see this is with dry period length. Recently, I worked with a herd with an average dry period length of 62 days, but 39% of the cows had dry periods greater than 70 days, and 37% of cows had dry periods less than 40 days. Peak milk yield for cows in the optimal dry period range of 40 to 70 days was 18 pounds higher than the cows outside that range, representing a huge opportunity for that farm just by controlling dry period length.
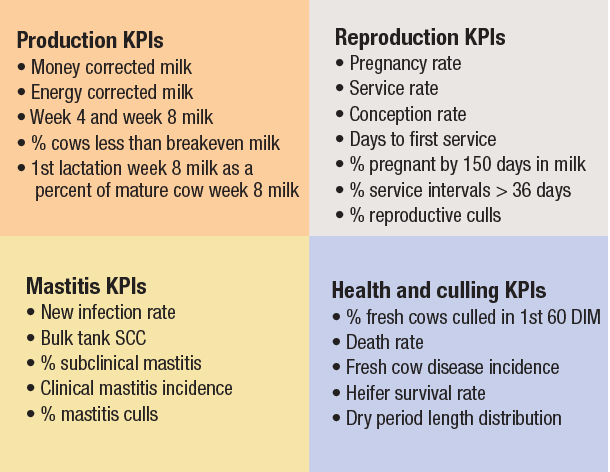
Key performance indicators (KPIs) are set to provide monitoring goals for a dairy operation. KPIs provide a roadmap for where we are and where we want to be. Remember, KPIs should be shared with all those involved in the processes that impact those KPIs. Too often, the managers know the KPIs, but the milkers, breeders and feeders don’t. Hundreds of KPIs exist for dairy operations. Every dairy producer has his or her own list of KPIs they like to look at. In a graphic are some of the KPIs I like to look at.
Industry leaders are taking analytics to a new level. Metrics I see them measuring include dry matter intake (DMI), feed efficiency, shrink, real-time feed inventories, real-time weather analysis and barn control, use of genomics, blood test diagnostics, colostrum quality, milking equipment analyses, wearable technologies, image-based technologies, inline milk biomarkers and detailed financial analyses.
In the future, more dairies will look toward these types of data to guide their operations. Small farms may read this and think, “That only applies to the big guys, not me.” While there are differences in how to interpret data based on herd size, the opportunities for analytics are immense for dairies of all sizes. Someone on the data-driven dairy wears the CIO (chief information officer) hat. Who is your CIO? That may be one of the most important questions you can answer for your operation.