Editor’s note: This is the second part of a two-part series that discusses how income over feed cost (IOFC) can be used to compare daily profit in Canadian herds. Click here to read part one.
Over 15 years, my partner and I facilitated a management club for a group of 20 or so farms. We would meet quarterly at a different farm, with a different topic for discussion at each meeting. We also calculated income over feed costs (IOFC) for each farm. The question I proposed in part one of this article featured in the April 2022 issue of Progressive Dairy came from this group.
Scenario: I am filling my quota (100 kilograms) with 60 cows in my 100-stall barn. My neighbour fills 100 kilograms with 75 cows in a 100-stall barn. Who is further ahead?
Good solution: More cows or more milk?
In part one of this article, we discussed how powerful the IOFC calculation is to help understand how to leverage the spread between marginal feed cost and marginal milk produced. So how can we use that to answer this question? We could simply multiply cow IOFC by the number of cows in the barn and compare the result (Table 1).

This will give us a good comparison, but I think we can do better. I mentioned previously that this difference would be larger in the U.S., as they would choose to milk 100 cows in each barn (or 120).
Better solution: Other variable costs
Some costs are fixed regardless of the number of cows you milk today (like the barn), and others change with the number of cows (variable costs like feed). What comes to mind if you were to think of the other main costs that appear on your income statement? Many of these would fall into the variable column: labour, breeding, veterinary, stall care and milking costs. As these relate directly to caring for the cow, Dr. John Fetrow has suggested bucketing these as “cow care” costs (CC). What about replacements and dry cows? These fluctuate directly with cow numbers and can be bucketed as replacement costs (R). Some of these will only increase marginally with each extra cow, while others will increase one for one.
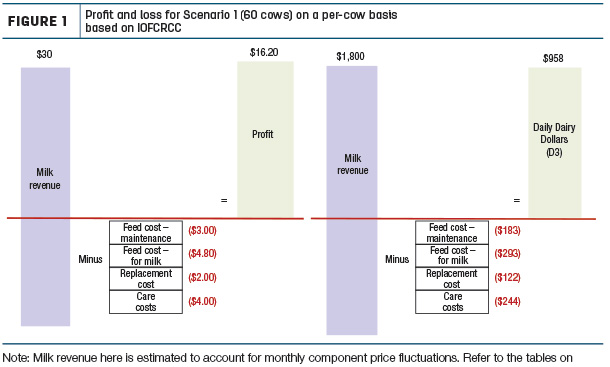
Now, there are some roadblocks for every problem I have tried to solve. For example, in part one of our discussion on IOFC, you may not know your cost to raise forage, so the market rate is almost always used. I called this a “black box.” We don’t know the best number for your farm today, but we can always calculate it later. Similarly, few farms will know this for the replacement and cow care costs (black boxes 2 and 3). For now, we can use regional numbers as placeholders. Ontario averages are $4 per day for cow care and $2 per day for replacement costs. Including these gives a better comparison of the actual price of milking additional or fewer cows (Table 2 and Figure 1).

Best solution: Making this number more meaningful for Canada
One of the strengths of using the current form of IOFC is: It is easy to wrap our heads around the per-cow measurement. But as we are not paid per cow, and the cow slot is not our limiting factor, we must convert it to a per-barn return. Next, I propose adding one more calculation to help make the income over feed cost with replacement and cow care costs factored in (IOFCRCC) genuinely Canadian. If we divide the per-barn return by kilograms of quota shipped, we can report the margin remaining per kilogram (Table 3).

This final number gives you the “profit” left per kilogram after accounting for milk, feed, care and replacement costs.
Finally, this also allows us to answer the question: Should I aim for more milk from fewer cows or milk additional cows with lower milk and feed cost? Table 4 shows that the cost of milking more cows is greater than the cost of feeding for more milk.
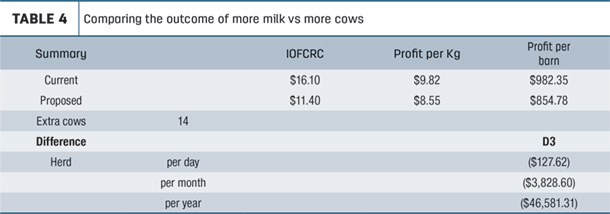
With 100 kilograms of quota, this amounts to $127.62 per day, or $46,581 annually. And here’s the problem: We are not accustomed to selling cows. Have you dumped milk this year? What if we get incentive days or access to more quota? The first step is understanding what drives profit daily (including discarded milk), and then we can build on this base in further articles.
The name
One last thing. We need to discuss the name. IOFCRCC could be kept, as it helps explain all the inputs, but it is a mouthful. The goal is to report a daily return of sorts, so would something like “daily dairy dollars” (D3) be easier to manage? If so, feel free to substitute D3 wherever you see IOFCRCC.
Summary
Tracking the financial progress of your dairy can look daunting. But adopting a few simple tools can make the process easier. First, the IOFC is easy to calculate and understood by most advisers. If you are intrigued to go deeper, adding replacement and cow care costs will allow you to report more accurate results. Finally, reporting on per kilogram of quota will give you a more accessible comparison metric under supply management.
Why should you bother going to all this trouble? According to the Ontario Dairy Farm Accounting Project, 15% of farms lost money in 2019. What will happen to this number as the margins get tighter?


