
Have you ever heard a neighbour say, “If I used every new product that claims to add a kilogram of milk, I would be at 60 kilograms”? This is usually said sarcastically to express hesitations over some new additive, and there may be some truth in the statement.

If the new product, whether it be a tool or feed, doesn’t fix the current and most substantial bottleneck on your farm, would you expect to see an improvement? How do you track these small changes? Maybe a better question is: How do you track significant changes? How do you know if you made more profit today? This month? This year?
I have asked many dairies this question. I hear a variety of responses; some use the change in the milk cheque, others the bank account balance, and some adjust based on the bookkeeper’s input, but many wait for the final annual accounting statements to know for sure. Whatever your system, do you know which dials and levers can be tuned to change your outcomes? I perceive this to be a considerable gap in our industry, and I have returned to school (after 21 years) to investigate these questions further.
The formal process to seek answers to these questions requires working backward from accounting statements. I am also interested in using the information already readily available, on a daily basis, to work forward. One tool with potential is the income over feed cost (IOFC) calculation.
Should we use IOFC as a report card?
The IOFC idea is not new. In fact, the first reference I could find to IOFC was in an Oregon State University Extension bulletin dated from 1924. IOFC uses your main daily revenue (milk sales per cow) and subtracts the biggest daily variable cost (feed). For example, a cow producing 40 litres at 75 cents per litre would regenerate $30 in revenue, minus approximate feed costs of $7, thus leaving a margin of $23 to spend on other areas of your operation. Advisers have used this calculation for years to benchmark changes on your farm over time and compare farms.
In my experience with producers, not everyone finds IOFC valuable. If you don’t understand all the inputs, it can look like something a feed adviser uses to make themselves look better. Others point to the feed cost total: your purchased feed cost plus your forage cost. The first is easy to find, but forage cost is harder to quantify; this is what I call our first “black box.” Most times, the current market rate to buy or sell forage is used in calculations because most farms do not know what it costs to grow their own. This is not perfect, but it is still helpful as a starting point. Another comment I have heard is: The IOFC is a report card for your nutritionist only, and if you trust them, you don’t need to bother with it.
What can hurt your IOFC?
It is easy to think of the IOFC as a report card for how well your nutritionist is doing. For example, can they balance the available feeds to make more than someone else could? There may be some truth in this, but it is better to think of it as a scorecard for both you and your nutritionist.
Where should you investigate if the score is lower than you would like?
1. Forage quality and storage: Dry matter is the most significant limiting factor in producing more milk. There is limited room in the gut for feed, so feeding more nutrient-dense and digestible forage will allow room for more nutrients – and in theory, produce more milk.
Growing, processing and storing better forages will also reduce the amount of purchased feed required, thus lowering costs. Some of this is straightforward; producing a haylage crop with 22% protein will allow you to buy fewer supplements. But what impact does storage have? Does poor bunk management lower your IOFC?
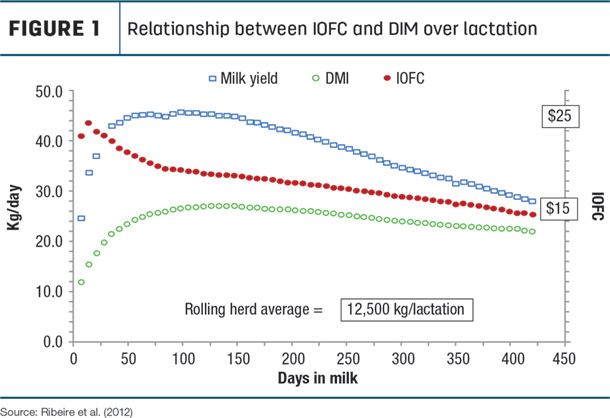
2. Days in milk (DIM): Cows produce along a decreasing curve over time. It is flatter, or more persistent, in first lactation and falls faster in older cows. If we were to compare individual cows, the cow with lower DIM will produce more (assuming the same genetics, parity, etc.). Similarly, having a lower herd average DIM will result in greater production from the same animals. After first lactation, this is approximately 1 kilogram for every 10 DIM change. Moving from 190 to 160 would add 3 kilograms per cow, with only marginal – if any – change in feed cost. This is precisely why aggressive reproductive management is essential for financial success (Figure 1).
If you want to produce the most milk per stall, aim to have the most efficient cows in the stall.
3. Overcrowding: Chasing fall incentives often result in farms keeping extra cows and delaying dry-off, both of which lead to the overcrowding of stalls and bunks. Milk and fat per cow both drop with overcrowding. Comparing your IOFC during undercrowding and overcrowding will allow you to calculate whether profit is being lost.
Is milk to feed linear?
As humans, we are wired to think in averages and straight lines. That’s why thumb rules are so appealing. But sometimes, we need to dig deeper into the story. The IOFC doesn’t work on a straight line. I will explain more later, but here’s a scenario to get you thinking: In provinces with a quota cap, the price is fixed at a lower cost than those without a cap, but the availability is very low (0.3 kilogram per month). As production has increased faster than quota purchase, some barns are undercrowded. They may own 100 kilograms of quota, are currently filling it with 60 cows on 80 stalls and would like to improve profit. If revenue is fixed, might it be wiser to reduce the ration expense and reduce milk production, with a goal of filling 100 kilograms of quota with 75 cows?
Scenario: Your barn is under-capacity. Should you produce more milk from fewer cows or cheapen the ration and produce the same volume of milk from more cows?
The power of marginal thinking
First, let’s use some accounting terms to discuss expenses. When adding up costs to run a business, we can split them into fixed and variable costs. The fixed, such as the cost of the barn, stay fixed no matter how many cows you milk in that barn. However, the variable costs will change based on the number of cows. For example, feeding more cows will require more feed on a per-cow basis.
Let’s use those same terms on an animal basis. If you think of feeding a dry cow, how much milk does she produce compared to her feed intake?
Obviously, there’s no milk, but she eats about 12 to 13 kilograms of dry matter (DM), or $3, worth of feed. This is required to maintain her body and feed the calf. Every cow in the barn will carry this maintenance, or fixed cost, no matter how much milk she produces. Any feed consumed above this level will go to milk or body condition. This feed is a variable, or marginal, cost. The more milk a cow can produce, the more feed she will eat. Table 1 shows how this works at various production levels.
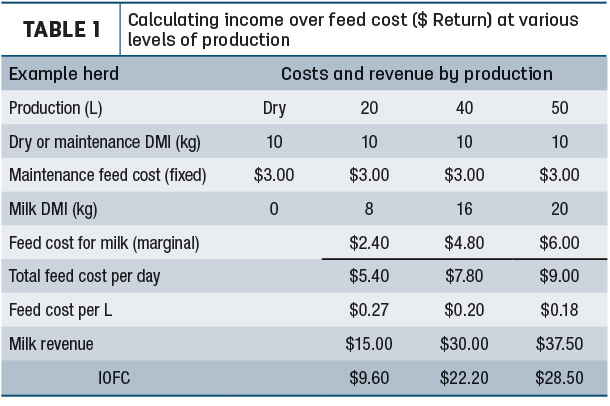
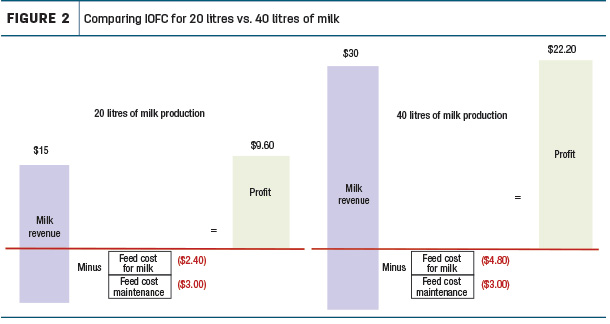
In Table 1, 30 cents per kilogram of feed DM is used for easy calculations. Higher production levels allow the fixed and marginal costs to spread or dilute over more litres, so the feed cost per litre of milk gets smaller. Figure 2 presents the same idea graphically.
If we use the energy contained in feed and milk for comparison, eating 1 extra kilogram of feed would allow the cow to produce 2.2 additional litres of milk. This is powerful on its own, but we also must consider the value of each. A kilogram of feed costs approximately 32 cents, whereas 2.2 litres of milk is worth $1.65 (depending on components and deductions). Practically speaking, every extra mouthful a cow eats has a return of 5.2 to 1 or 415%. This explains why your feedbunk should never be empty.
Returning to our initial question, this would suggest you should aim to produce the most milk per cow. In the U.S., this is precisely the answer. They can sell every extra litre produced. The main bottleneck in shipping more is the barn or number of stalls available. They use IOFC to calculate the best return on a “slot.” If you place one cow per stall, the daily return for your barn would be the number of cows multiplied by the cow’s IOFC. So how does this work under supply management? I have heard many producers say, “I can’t sell any more milk, so why would I produce more?” The short answer is: Milk is more valuable than feed. Higher milk per cow usually always results in a greater margin. Does this mean we should make the ration more expensive? Absolutely not. We should always aim to produce more milk in the most cost-effective way, but if we make decisions that reduce milk production, we lose profit. If you track and compare your herd’s IOFC, you can start to understand what the other levers and dials may be to generate greater profit on your dairy moving forward.
To fully understand this within a Canadian context, we need to add a couple of other ideas to the discussion. Click here to read part two of this article where I hope we will finally answer the question, “How much did you earn today?”


