In a field outside Truro, Nova Scotia, a Holstein flicks her tail in the sunlight. The barn is quiet. The air smells of hay, damp earth and purpose. Above her, far above, three satellites glide invisibly across the sky: NASA’s Terra, Europe’s Sentinel-5P and Japan’s GOSAT. Together, they are measuring something that cannot be seen or smelled but is at the heart of the future of Canadian agriculture: methane.

For 15 years, these satellites have been capturing weekly snapshots of atmospheric methane across the country. Not from spaceports or war rooms, but from ordinary farms. Their invisible gaze has silently documented the breath of a nation’s cows – from dairy sheds in Abbotsford to family farms in Prince Edward Island. The result: an unprecedented archive of greenhouse gas data, covering over 1,080 dairy farms, coast to coast, week by week, season by season, from Jan. 1, 2010, to Dec. 31, 2024.
Until now, that data has remained mostly inaccessible – locked in obscure scientific journals or university servers, far removed from the hands that actually milk the cows.
But that is changing.
Meet DairyAir Canada – a new mobile app that puts 15 years of satellite-powered methane insights directly into the hands of Canadian dairy farmers. It doesn’t just visualize emissions. It contextualizes them. It doesn’t just report numbers. It tells stories – of seasons, systems, silage and sometimes of success.
And it does this not with fanfare but with facts.
This is not another climate app for urban armchair environmentalists. This is a tool designed for boots-on-the-ground farmers and business leaders who want clarity, confidence and a competitive edge in an increasingly carbon-conscious world. It is, quite literally, Canada’s methane benchmarking engine in your pocket.
A national gift
The app is a product of the MooAnalytica research group, a multidisciplinary team based at Dalhousie University, led by experts in digital livestock farming, computer science and environmental monitoring. Funded through national and provincial research grants and supported by Dalhousie’s faculties of computer science and agriculture, the project represents a significant public-good investment in the future of Canadian dairy.
There’s no corporate catch. No premium tier. No data selling. It is, in every sense, a scientific gift – a freely available decision-support tool created for Canadian dairy farmers by Canadian researchers, using Canadian data.
To describe DairyAirCanada as merely an “app” would undersell its depth. It is a climate resilience tool, an emissions benchmarking platform, a supply chain differentiator and a personal methane historian – all wrapped into one interface that fits in the palm of a hand.
The elephant in the barn
Methane is agriculture’s elephant in the barn. While cows may get all the blame in cocktail-party conversations about climate change, for farmers, methane is more than a buzzword. It is a potent, complex and tightly regulated challenge – 28 times more powerful than carbon dioxide in its global warming potential and increasingly the focus of both national climate policy and international market access.
Unlike carbon dioxide, which arises from combustion and fossil fuels, methane on dairy farms largely comes from a biological process: enteric fermentation. When cows digest their feed, they produce methane as a natural byproduct. Some is emitted through manure. Some through belching. None of it is evil. All of it is measurable.
Until now, Canadian farmers lacked the tools to monitor their methane performance meaningfully. Emissions audits, when they happened at all, were infrequent, expensive and often non-specific. Methane data remained buried in policy documents, carbon inventories or inaccessible spreadsheets.
This app turns this situation on its head. For the first time, it lets farmers see how their emissions have evolved across time, how they compare to others nearby and what influence management decisions may have had on their methane footprint.
From orbit to barn floor: The science behind the app
The data engine behind the app is nothing short of remarkable. Each week, three major satellite missions – NASA’s MODIS aboard the Terra and Aqua satellites, ESA’s Sentinel-5P and JAXA’s GOSAT – collect high-resolution atmospheric methane concentration readings.
These readings are not farm-specific at first. They are pixelated snapshots of the atmosphere, filtered through layers of cloud, weather variability and surface conditions. Turning that raw data into actionable farm-level insights requires complex modeling, machine learning and spatial normalization techniques – work that the MooAnalytica team has been refining for years.
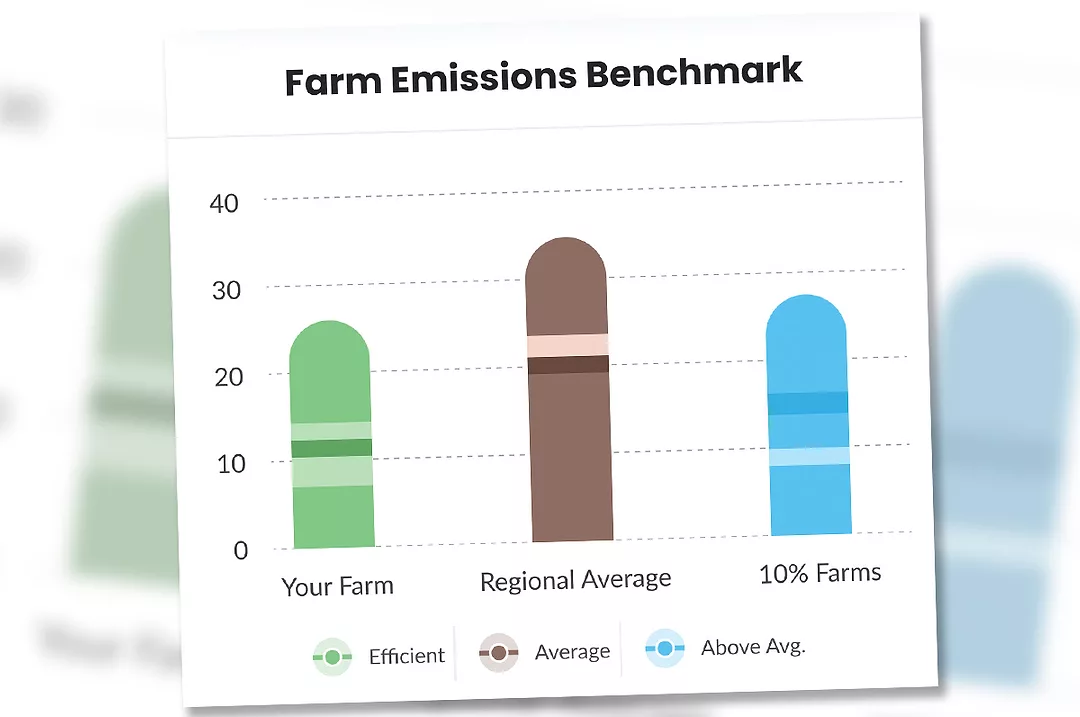
By integrating farm boundaries, weather records, historical land-use data and temporal smoothing algorithms, the app assigns each farm a methane emissions profile – weekly, seasonal and yearly. Farms can then see their emissions in relation to:
- Farms within a 50- or 100-kilometre radius
- Their own provincial average
- The national distribution of emissions, including the top 10% of lowest emitters
This allows not just passive reflection, but active benchmarking.
Are you a net zero leader – in the top 10% of lowest methane emitters nationwide? Have you improved your emissions year over year by more than 5%? Do you show low variability across seasons, indicating consistent, optimized management?
The app answers these questions with nuance, not judgment. It is not a policing tool. It is a mirror – and sometimes a map.

Courtesy image.
Seasonal clues and language of methane
Farms are not static. Neither are emissions. What makes the app particularly valuable is its ability to show seasonal trends across multiple years. For example:
- Is your farm emitting more in spring, when calving peaks and feed transitions occur?
- Does your winter manure storage system result in higher emissions than the average for your region?
- Did the COVID-19 pandemic years (2020-21) affect your emissions output compared to before and after?
These are not abstract curiosities. They’re clues. They help isolate what’s working, what’s not and when to intervene.
A farmer in Alberta may discover that emissions spike each summer due to barn heat and ventilation issues. A counterpart in Nova Scotia might find their emissions drop after switching to pasture grazing in early fall. These insights are not just academically interesting. They are operationally transformative.

Courtesy image.
Business value: A tool for different and decision
While the app is designed for farmers first, its implications ripple across the dairy value chain. Dairy processors, co-ops and sustainability officers increasingly need verifiable data on methane emissions for:
- Carbon labeling
- Export certification
- Retail sustainability programs
- Carbon credit eligibility
The app allows farms to export reports that demonstrate emissions performance over time, with regional comparisons and seasonal context. It can become a tool for carbon audits, supply chain reporting and even value-added branding.
In a market where climate-smart credentials are no longer optional, this app is a market differentiation strategy. Farms that can demonstrate consistent methane reductions may become preferred suppliers. Co-ops could use the app to identify regional leaders or laggards. Policymakers may find it a useful ground-truthing instrument for national inventory calculations.
And all of it stems from one farmer-facing dashboard.
Potential use cases: From barn boots to boardrooms
While the app is only just entering the market, potential applications abound. Consider the following examples:
- A sustainability manager at a dairy cooperative uses the app to shortlist the top 25 low-emission suppliers for a climate-resilient milk brand.
- An ag-tech consultant helps a group of farms compare their seasonal emission curves and recommends barn ventilation changes based on year-on-year summer spikes.
- A dairy nutritionist adjusts ration formulas for a herd after observing methane intensity increases each winter post-2017.
- A provincial extension agent hosts workshops using the app to train farmers in benchmarking and emissions literacy.
- A farmer’s daughter, home from university, uses the app’s historical trends to pitch a new emissions-reduction pilot to her parents – and wins the argument with data.
In each case, the app is not replacing traditional knowledge. It is amplifying it.

Courtesy image.
The power of perspective
One of the app’s most compelling features is its ability to contextualize emissions. Farmers are no longer comparing themselves to vague national targets or anonymized industry averages. Instead, they are seeing themselves in relation to farms nearby, in similar landscapes, with similar weather and constraints.
That 100-kilometre radius comparison is not a gimmick. It’s a recognition that farmers don’t compete with Ottawa or Geneva. They compete with the next township over. They innovate not against the planet, but in step with its rhythms.
By enabling this level of local benchmarking, the app empowers more targeted action – and encourages the sharing of best practices within communities, not just between countries.
The app does not penalize farms that are still learning. It encourages them. Through weekly tip cards, season-aware suggestions and farm-specific feedback, the app nudges improvement without judgment.

Courtesy image.
What it's not
It’s important to be clear: DairyAir Canada does not track live emissions. It is not a real-time sensor. It does not replace on-farm tools like feed analyzers, manure samplers or greenhouse gas probes.
Instead, it offers something more strategic: a long-term lens, grounded in satellite science, that shows how your farm’s emissions have moved, season by season, over the past 15 years. It is a platform for reflection, pattern recognition and smarter decision-making.
It does not guess. It observes. It does not prescribe. It presents.
And that, in a data-saturated world, is a rare virtue.
Final thoughts: What's at stake
Canada’s dairy sector is at a crossroads. The days of farming by gut instinct alone are ending – not because intuition has failed but because precision is becoming essential.
Methane is no longer just an environmental issue. It is a business variable, a reputation factor, a regulatory concern and, increasingly, a consumer expectation.
DairyAir Canada provides the one thing farmers and business leaders need most in this landscape: clarity.
Clarity about where we’ve been. Clarity about where we stand. Clarity about how to move forward – region by region, season by season, herd by herd.
The future of climate-smart dairy is already written in the sky. Now, thanks to this app, it can be read from the barn.
DairyAir Canada is available for download.