


Overall, the 2026 beef production forecast is lowered to 25.79 billion pounds, only 20 million pounds below last month’s projection. Compared to last month’s expectations, the pace of steer and heifer slaughter was slower in March. Further, slaughter data in early April have lowered slaughter expectations from last month for the second quarter. This decline is partially offset by heavier anticipated carcass weights across all quarters.
The latest Cattle on Feed report, published by the USDA National Agricultural Statistics Service (NASS), showed a March 1 feedlot inventory of 11.549 million head, 0.2% below the 11.577 million head in the same month last year. Feedlot net placements in February were 4.5% higher year over year at 1.561 million head. Marketings in February were 1.522 million head, down 6.8% year over year. The slower pace of marketings was, in part, influenced by the three-week strike at the JBS packing plant in Greeley, Colorado. The union’s work stoppage began on March 16, and the union announced it was ending its strike on April 7.
As shown in Figure 1, average carcass weights in March posted all-time highs above record weights from late last year. While nearly as many cattle are on feed as last year, 18% more have been on feed beyond 150 days, and about 91% more cattle have been on feed beyond 180 days. It is anticipated that carcass weights will remain elevated, and as a result, carcass weights are raised in the outlying quarters.

Despite market volatility, cattle price forecasts unchanged
In March, the weighted-average price for feeder steers weighing 750-800 pounds at the Oklahoma National Stockyards was $366.16 per hundredweight (cwt), nearly $83 above March 2025. That differential adds up to over $600 per animal that feedlots paid for the same type of feeder cattle, compared with last year. It is worth noting that weekly prices in March had a relatively wide range, from $349.99 to $373.62 per cwt, demonstrating broader market volatility. In the first sale of April, feeder steer prices dropped roughly $1 from the previous week to $372.47 per cwt. Supply fundamentals still play a role in supporting prices in the outlying quarters. After adjusting for actual price data through the first quarter, the outlying quarters remain unchanged from last month for an annual price of $367.22 per cwt, a 14% increase from last year.
Slaughter steers in the 5-area marketing region averaged $237.14 per cwt in March, almost $29 above 2025. However, prices declined about $7 from the February average, which is just the seventh time prices have declined from February to March since the series began 25 years ago. Prices through April 8 have been reported at around $245 per cwt. Wholesale prices suggest that demand remains robust through early 2026. Weekly comprehensive wholesale beef prices are showing quite a bit of strength ahead of what is typical in the run-up to the spring grilling season in April and early May (Figure 2).

Per capita beef availability in the U.S. is projected to surpass 2025 by 1%. Upon updating the first quarter on reported data through March, the remaining quarters are unchanged for an annual price of $241.66 per cwt.
Beef exports
The USDA forecasts in April incorporate recently released January and February international trade data. Table 1 compares year-to-date beef exports through February for the top six export markets for 2025 and 2026, as well as China for historical context. Year-to-date exports to China were down 95% compared to the same period last year. Exports to China fell off starting in April 2025 after the General Administration of Customs of China (GACC) allowed the registration of most U.S. beef export facilities to lapse in March 2025.

Exports to most other major markets are also down year over year, but exports to Taiwan are up 19% year over year. Exports to Hong Kong are up more than 13 million pounds year over year, or 110%. Exports to smaller markets outside the top six and China (ROW in Table 1) are up a combined 7 million pounds, or 14%. The largest contributors to higher ROW exports include Indonesia, Dominican Republic, United Arab Emirates, Guatemala, European Union and Colombia.
Based on the slower pace of exports in January and February, and reduced domestic beef production leading to tighter exportable supplies, the export forecast for the first quarter is lowered 20 million pounds to 590 million pounds, and the second-quarter forecast is lowered 10 million pounds to 620 million pounds. The 2026 annual forecast is 2.365 billion pounds, which would be a year-over-year decrease of 8%.

Beef imports
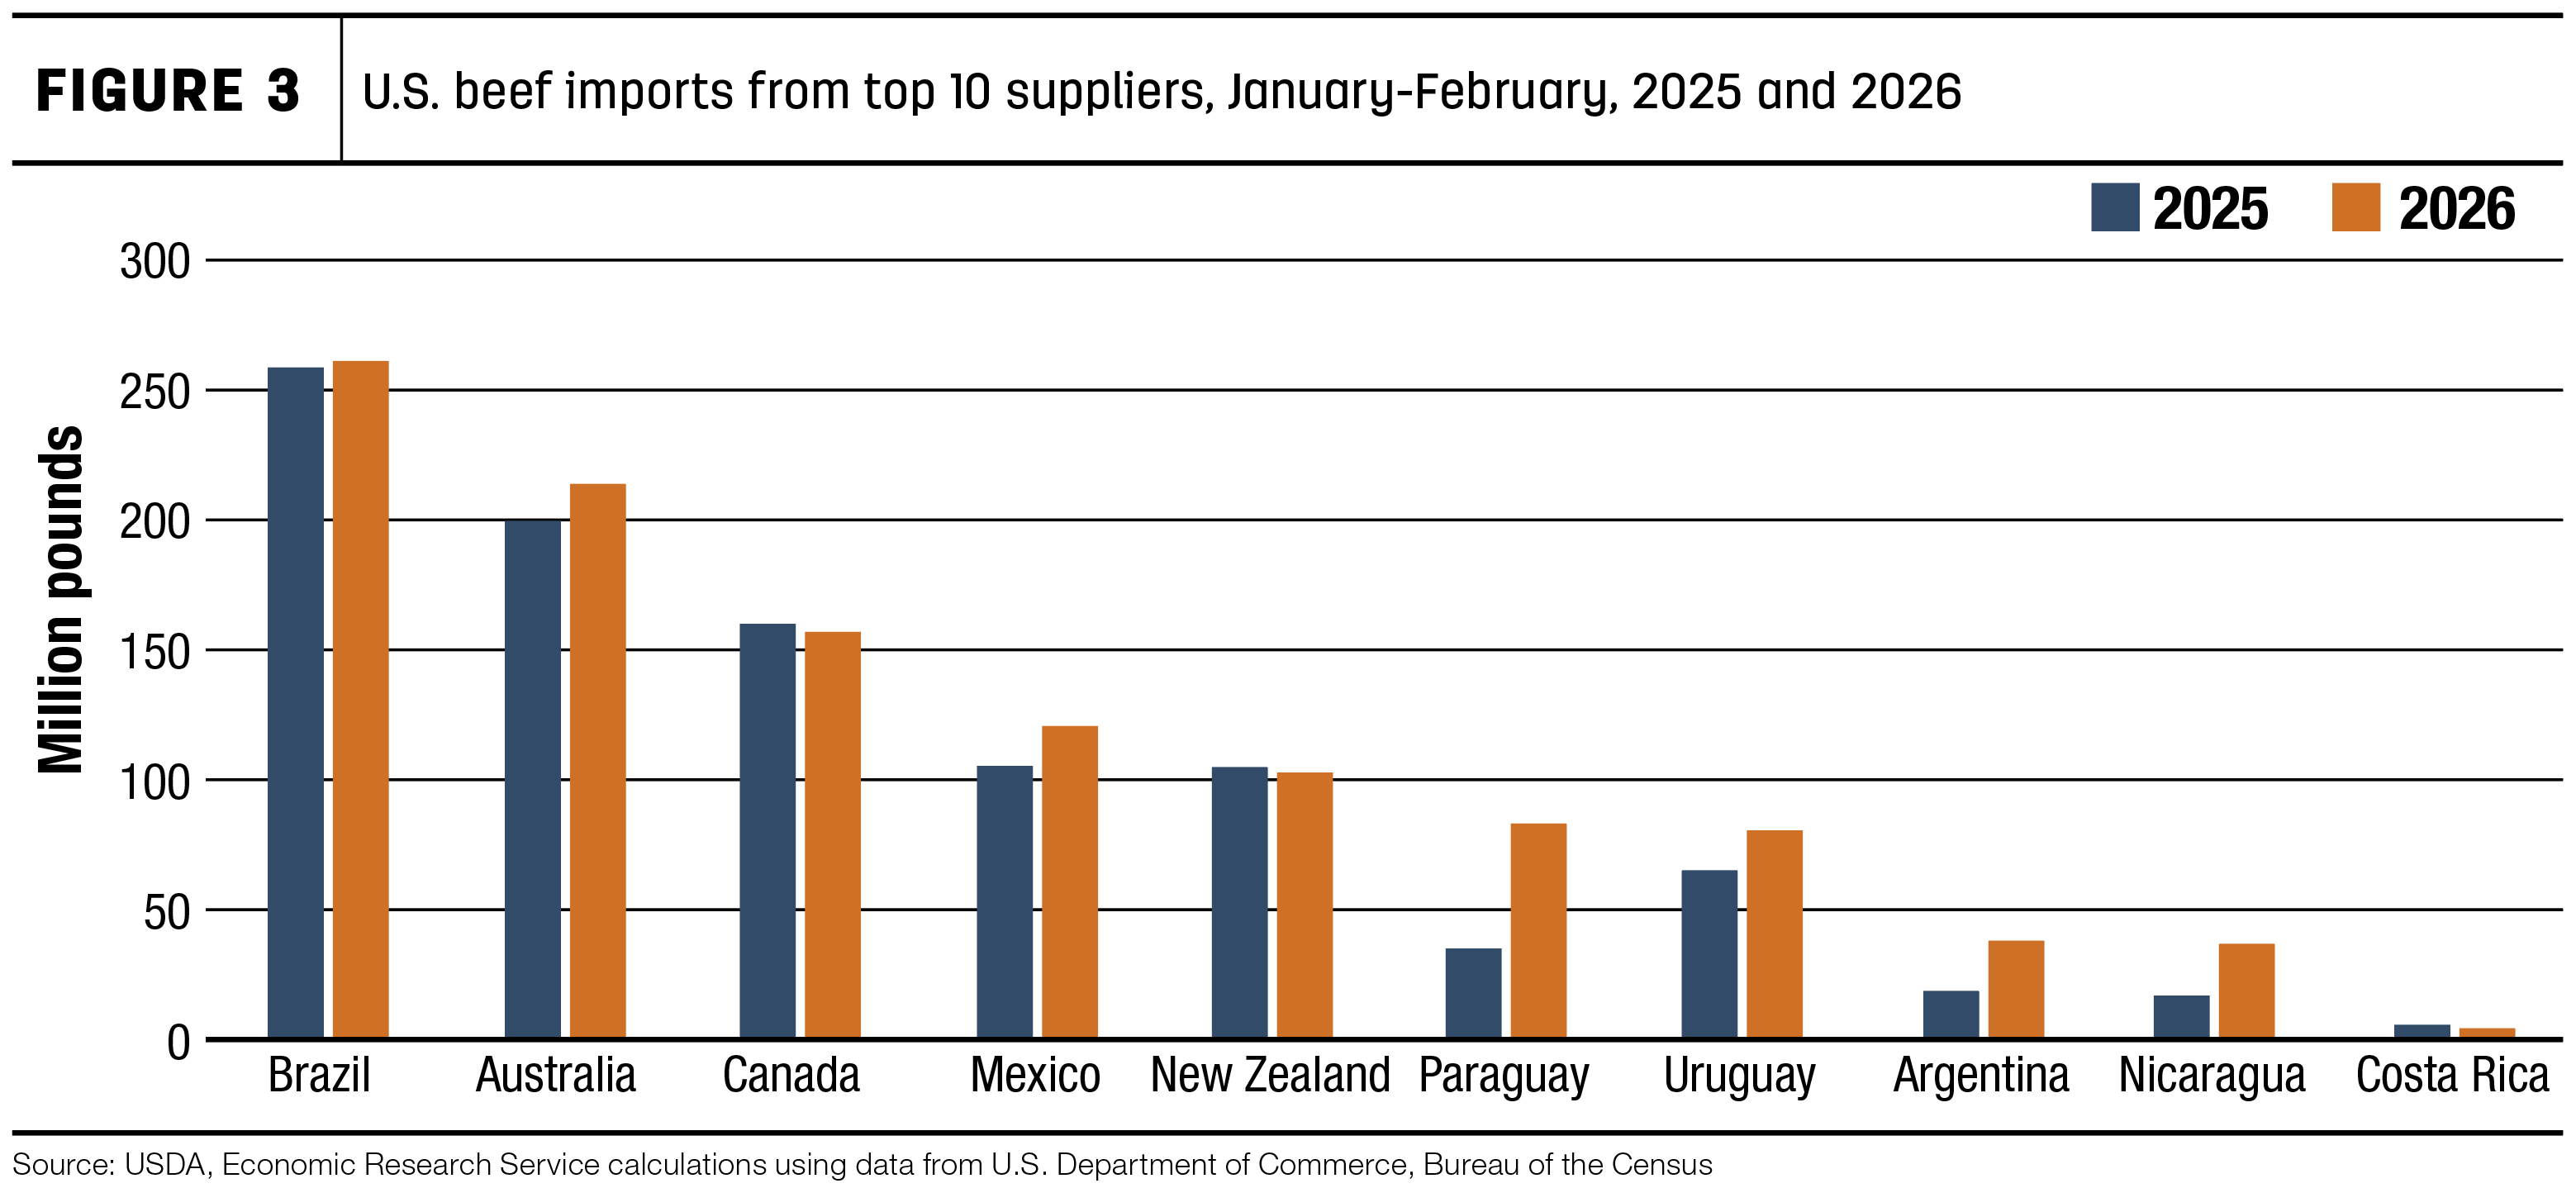
Beef imports in January and February totaled 1.1 billion pounds, about 13% higher compared to the same period last year (Table 2). Imports from Brazil, the largest supplier so far this year, were nearly unchanged from a year ago, but imports from Australia, Mexico and countries outside the top five contributed to the higher overall imports. Imports from Canada and New Zealand were slightly smaller than a year ago.
Figure 3 breaks out the year-to-date imports from the top 10 suppliers for 2025 and 2026. Imports from Paraguay, Argentina and Nicaragua were all more than double from a year ago. Imports from Uruguay were up 23%. Combined, these four markets contributed an additional 104 million pounds over a year ago, nearly 80% of the overall increase in total U.S. beef imports.
Based on continued strong demand for imported lean trimmings, the import forecast for the first quarter is raised 25 million pounds to 1.625 billion. The forecast for the third quarter is also raised 25 million pounds to 1.375 billion, and the fourth quarter is increased 65 million pounds to 1.315 billion pounds. The annual forecast for 2026 is 5.79 billion pounds, almost 6% higher year over year.


