The latest Cattle on Feed report, published by the USDA National Agricultural Statistics Service (NASS), showed a March 1 feedlot inventory of 11.838 million head, 1% above 11.685 million head in the same month last year. After factoring in an extra weekday for leap year, feedlot net placements in February were 10% higher year over year at 1.834 million head, higher than analysts projected. However, when factoring in a year-over-year decline in January, the total volume of net placements for January and February combined was only 0.2% higher than the same period last year.
Marketings in February were 1.793 million head, up over 3% year over year, though on a weekday basis, the pace was just under 2% behind last year. The slower pace of marketings has extended into March based on fed cattle slaughter estimates.
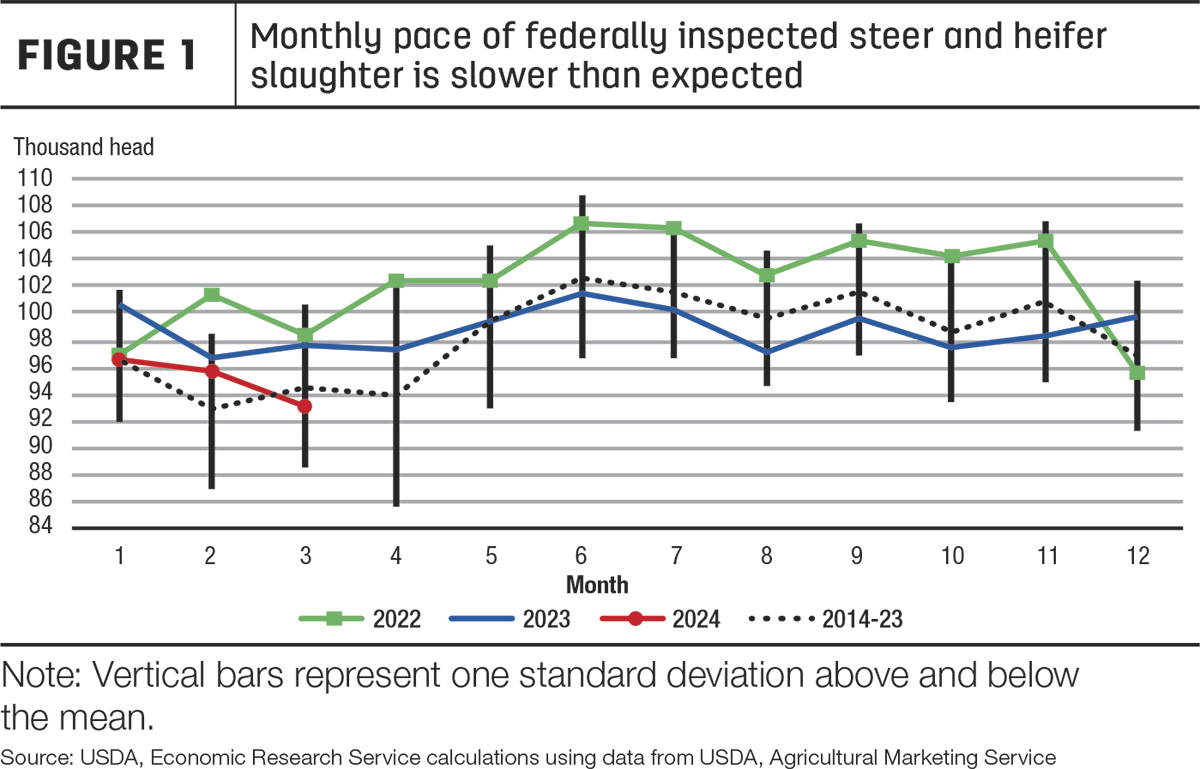
Based on USDA Agricultural Marketing Service (AMS) reports of actual slaughter under federal inspection and estimated daily livestock slaughter, the pace of fed cattle slaughter in March was about 5% behind last year, suggesting lower year-over-year marketings for the month as well. This is a reduction from last month’s expectations.
Cattle formerly expected to be marketed in the first quarter are now anticipated to shift to the outlying quarters.
Further, cow slaughter slowed more than anticipated from last month (Figure 1). Some of the decline in first-quarter cow slaughter is expected to be partly offset by higher expected slaughter in late 2024.
The pace of cow slaughter in second-half 2024 is expected to be above its projection last month as higher cull cow prices are forecast and expected to draw more beef cows into the slaughter mix.
Partly reflecting the slower pace of slaughter, for the week ending March 23, carcass weights for steers and heifers are at record levels for this time of year. The year began with weights at or near record levels before rapidly declining, likely due to winter weather inhibiting feed efficiency. Figure 2 shows carcass weights for steers and heifers through the first 12 weeks of the year for 2023, 2024 and the minimum and maximum prices in 2014-23. 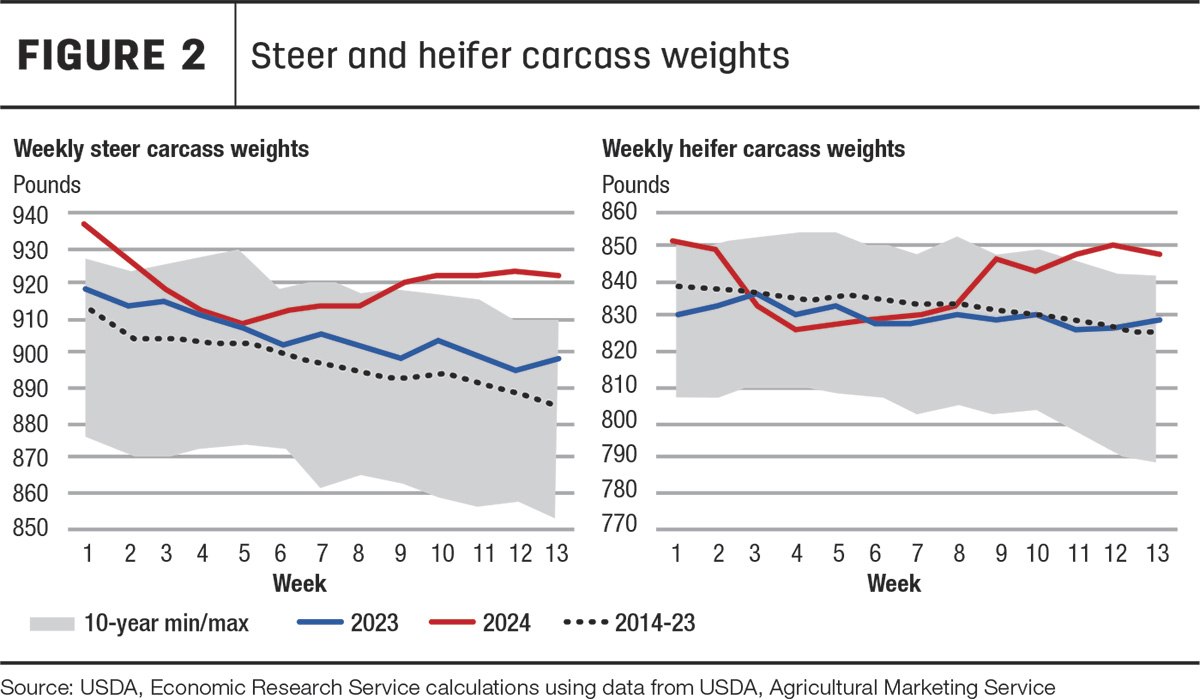 In early February, weights reversed their downward trend and have since
climbed to record levels in March. This increase is likely the result of
feedlots attempting to maximize poundage per animal as packers reduced
slaughter schedules in the first quarter and pressured prices for fed
cattle. Although weights will decline seasonally in the second quarter,
they are expected to be above year-ago levels for the quarter.
In early February, weights reversed their downward trend and have since
climbed to record levels in March. This increase is likely the result of
feedlots attempting to maximize poundage per animal as packers reduced
slaughter schedules in the first quarter and pressured prices for fed
cattle. Although weights will decline seasonally in the second quarter,
they are expected to be above year-ago levels for the quarter.
Heavier cattle and a shift in slaughter raise 2024 production
The forecast for first-quarter beef production is lowered 35 million pounds, primarily based on AMS reports of actual slaughter under federal inspection showing a slower pace of fed cattle and cow slaughter than previously expected. Partly offsetting the decline in estimated slaughter are much heavier steer and heifer carcass weights than anticipated.
The outlook for second-quarter beef production partly reflects a temporal shift of fed cattle slaughter out of the first quarter and into the second quarter. In addition to the expectation of a more rapid pace of second-quarter marketings given the number of cattle on feed over 150 days, relatively heavy steer and heifer carcass weights in the first quarter are expected to carry over into the second quarter. As a result, second-quarter 2024 beef production is raised 65 million pounds from last month’s forecast.
Third-quarter projections are raised 55 million pounds on higher expected fed cattle and cow slaughter. This increase in fed cattle slaughter stems from higher expected marketings, raised on more anticipated first-quarter placements than last month. In the fourth quarter, production is forecast up 45 million pounds as more fed cattle are expected to be marketed then, as they are expected to remain on feed longer, along with higher cull cow slaughter. The outlook for 2024 beef production is raised by 130 million pounds to 26.455 billion pounds.
Cattle prices dip but tight supplies remain supportive
In March, the weighted-average price for 750- to 800-pound feeder steers at the Oklahoma City National Stockyards was $252.09 per hundredweight (cwt), more than $64 above March 2023. The feeder steer price reported on April 8 reached $244.41 per cwt, about $50 above the same week last year. Based on April weekly price data and stronger first-quarter placements that leave fewer calves available for placement in the second quarter, the second-quarter forecast is raised by $3 to $250 per cwt. Prices in late 2024 are unchanged from last month, which equates to an annual feeder steer price of $254.50 per cwt, a 16% increase from last year.
Fed steers in the 5-area marketing region averaged $187.55 per cwt in March, $22 above 2023. To date, prices have followed seasonal patterns, as indicated by the 20-year index in Figure 3, which steadily climbed through most of the first quarter. First-quarter prices peaked in the week ending March 24 at $189.56 per cwt, after which they declined almost $6 over the following three weeks.
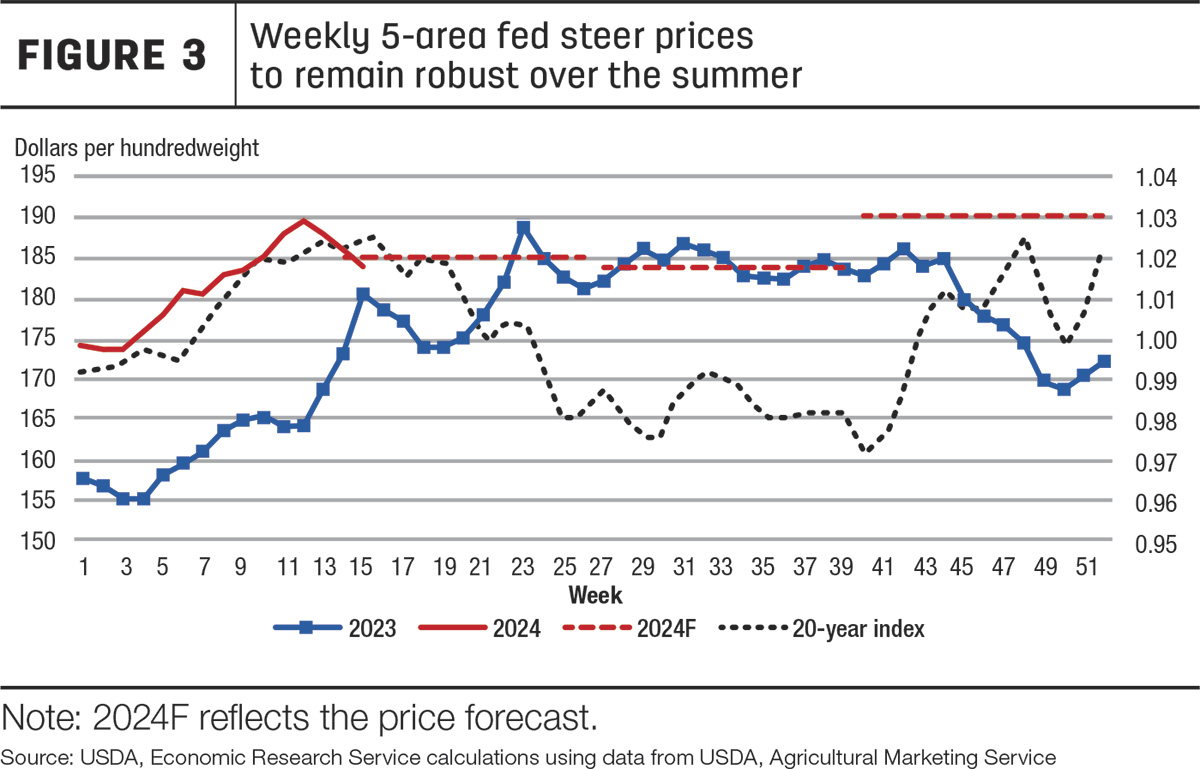
Despite concerns in the futures market, cash prices remain strong and prices may have peaked sooner than normal, but fundamentals remain for slaughter to increase in the second quarter. Based on current prices and expectations of relative strength in wholesale beef prices and declining supplies of fed cattle, the second-quarter price forecast for fed steers is raised $2 from last month’s forecast to $185. Compared to last month, more cattle are expected to be pulled out of feedlots in late 2024. Subsequently, third- and fourth-quarter price projections are also raised $2 to $184 and $4 to $190, respectively. Overall, the annual price is forecast at $185, more than 5% above 2023.
Beef exports raised slightly from last month
Monthly exports in February were 244 million pounds, 3% less than last year but just slightly above the 2019-23 average (Table 1). Exports to Taiwan and China were somewhat stronger than expected. February exports to Taiwan were counter-seasonally higher than January, increasing to nearly 16 million pounds, 15% higher year over year. This was also the largest monthly shipment to Taiwan since shipments started falling well below the five-year average in August 2023. Exports to China were only 3% lower year over year, but 85% above the five-year average.
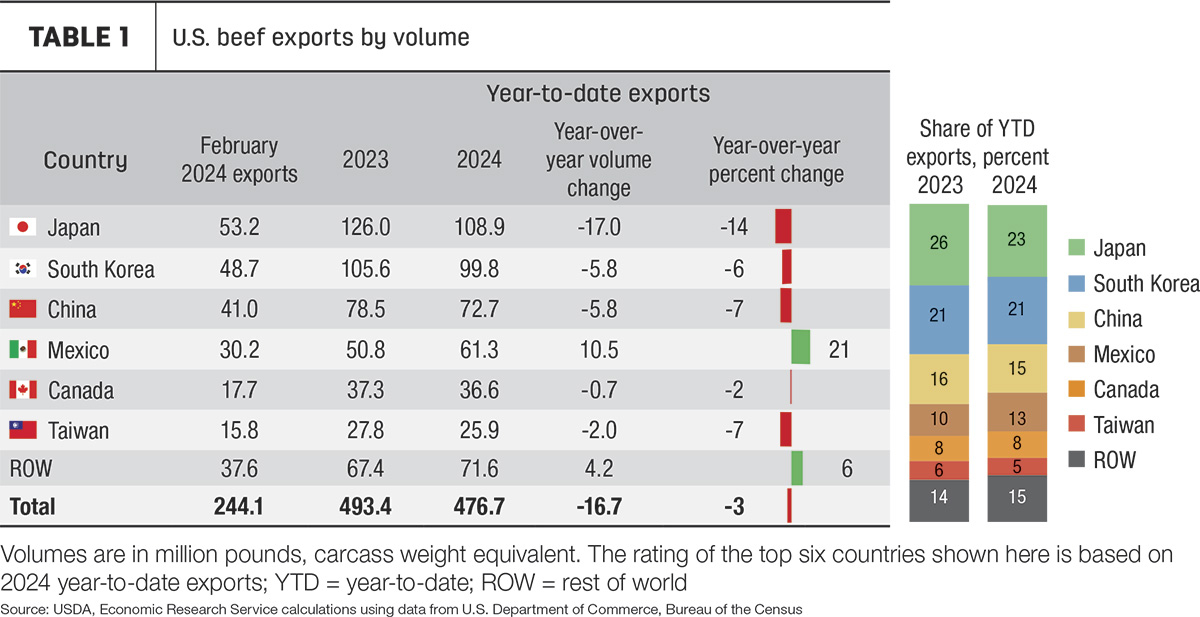
On a global scale, as other major beef-exporting countries increase their shipments, U.S. beef is expected to continue to be less competitive. According to data from the Trade Data Monitor, the unit values of year-to-date beef exports through February from Brazil, Australia, Argentina and New Zealand are all between 5% and 10% lower year over year. The unit values of exports from the U.S. were nearly 13% higher year over year. Demand for high-quality U.S. beef will likely face economic headwinds throughout the year as limited supplies keep prices high.
Based on the stronger-than-anticipated exports in February, the forecast for first-quarter exports is raised 20 million pounds to 740 million. With continued expectations of limited domestic production and exportable supplies – combined with steeper competition from other beef-exporting countries – the forecasts for the remaining quarters are unchanged for an annual forecast of 2.805 billion pounds. This would be about an 8% decrease year over year.
Beef import tariff-rate quota fill rates ahead of last year
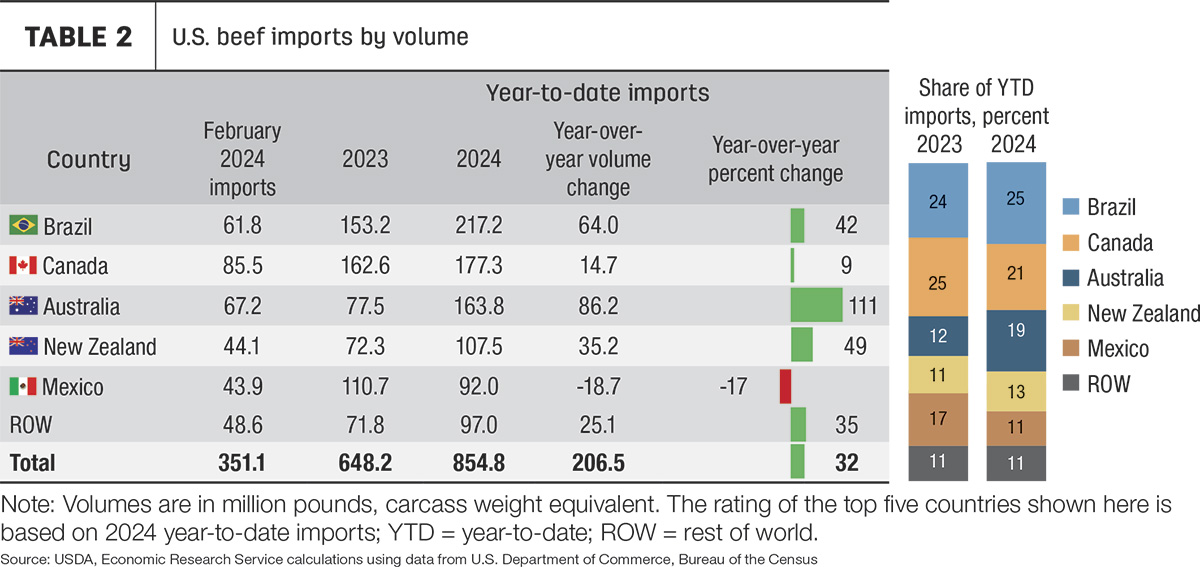
February beef imports were 351 million pounds, 24% higher year over year and a record for the month of February. Similar to the pattern of the past two years, February imports showed a steep decline from the record-setting January imports. This is partly the result of the tariff-rate quota (TRQ) system where beef imports up to a certain limit are subject to a smaller tariff; once that quota is reached, the imports are subject to a higher out-of-quota tariff. The quotas restart on Jan. 1 each year. Over the past three years, some countries have begun sending product to the U.S. in the late part of the year to be placed in bonded warehouses where they can be stored without being taxed until they are released and officially counted as imports on Jan. 1 under the new quota.
Figure 4 shows the fill rates for the TRQs as of the first week in April this year compared to last year. The TRQ for “Other countries” is open to all countries that do not have a specific quota or free trade agreement, including Brazil.
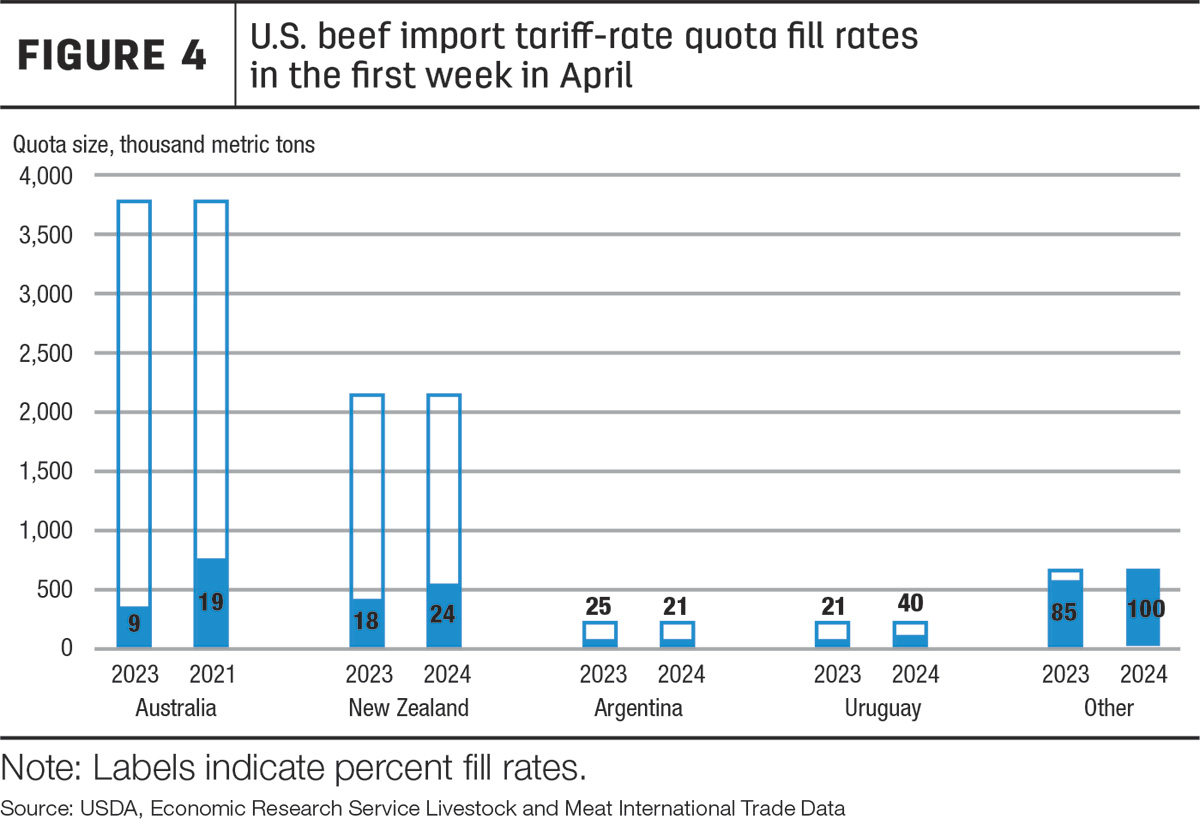
Imports from Brazil are about 42% higher year over year through February. The “Other” TRQ was filled as of Feb. 27, according to the U.S. Customs and Border Protection Quota Status Report.
Also of note in Figure 4 are the nearly doubled rates of fill for Australia and Uruguay. In recent years, the main TRQ of interest has been the Other TRQ, but with record imports expected, other quotas may be filled this year as well. After only the first three months of the year, the TRQ for Uruguay is already 40% filled compared to 21% in 2023. Imports under the Australia TRQ are about on pace with their status in early April 2015; the TRQ was filled in November of that year, the last time that occurred by year-end.
The beef import forecasts are unchanged from last month with the 2024 annual forecast at 4.175 billion pounds (Table 2). If realized, this would be a 12% increase year over year and the largest annual beef import total on record.