In the dairy industry, we know manure is valuable. But how valuable? Typically we look to nutrient composition as the major indicator of dollars and cents. However, examining when, where, how, how much and even how well manure is applied can help dairy farms of all sizes start to realize its real value.
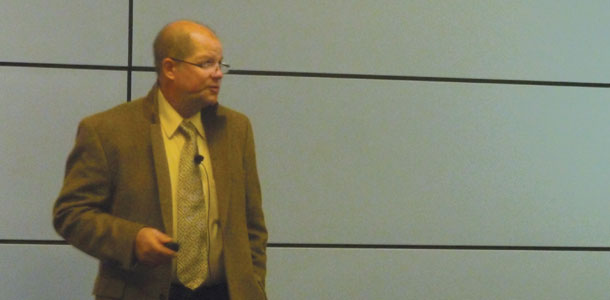
“We all know that manure has value, but we have to know a few things if we want to use manure as a fertilizing product,” said Dr. Brad Joern, professor of agronomy from Purdue University, during a presentation at the 2014 World Dairy Expo in Madison, Wisconsin.
The factors that help determine the value of manure are:
- Manure nutrient content
- Application rate
- Losses between application and crop uptake
- Where to apply manure to get the biggest return

How valuable is valuable?
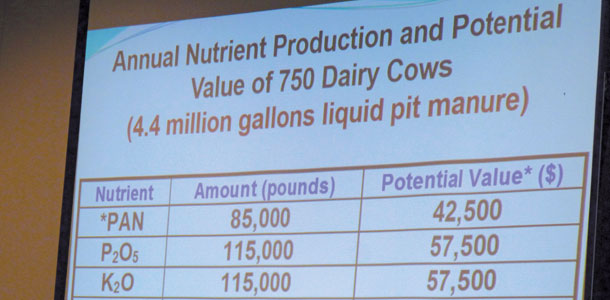
Focusing on a few major nutrients (nitrogen, phosphorus and potassium), a 750-cow dairy (for example) will generate about 4.4 million gallons of liquid manure per year, which is equivalent to $150,000 worth of fertilizer.
Dairy cow nutrition plays a large role in the nutrient content of manure. “When we start looking at the phosphorus requirements of the dairy cow, by-product feed sources (such as dried distillers grains or DDGs) result in much more phosphorus in the manure,” Joern said.
Manure does not supply nutrients in ratios that match crop need, so it’s important to pay attention to soil test results. “The value of your manure depends on where you put it,” Joern said. “If your soil tests are high, there is no point in spreading manure at that location.”
Hidden costs and manure application
Labor and fuel costs should also be factored into the value of manure. “It’s always the farthest fields that need the most fertilizer,” Joern joked. “It might not pay to apply manure to those fields until your labor demands are lower, for example when the crops are off in the fall.”
Unfortunately, improper manure application can reduce the value of manure and even cause field damage. Spreaders that are not calibrated correctly can run out of manure too quickly and lead to soil compaction, when the farmer drives over the ground to reload. Further, the time it takes to continuously reload leads to additional labor costs.
“The rate of application ought to be a function of your application equipment and the width of the field,” Joern said.
Examining total miles spent hauling manure during the year can help determine if application equipment is appropriately sized or even if hiring a custom manure hauler is necessary.
“How big is your honey wagon? If you have a 2,500-gallon manure spreader, upgrading to 5,000 gallons will cut your miles and trips in half,” Joern said. “There might also be certain periods of the year where being on a tractor for an extended amount of time isn’t practical – you might consider hiring a custom operator.”

“Woefully inadequate”
Nutrient availability algorithms used by land grant universities to develop nutrient management plans for farms are inadequate and often omit important details. For example, time of application is not a consideration, and some states do not differentiate between total nitrogen and ammonium nitrogen.
“Don’t come down too hard on the universities because there is no way to get funding to make the algorithms better. No one is paying these bills, and most states don’t have a fertilizer check-off program,” Joern said.
Nitrogen availability also varies from state to state. “If you inject liquid hog manure in Iowa, it’s considered as available as commercial fertilizer,” Joern said.
However, in surrounding Midwestern states, such as Wisconsin, that number can drop as low as 68 percent available compared to commercial fertilizer. To complicate manure matters further, if someone farms across state lines, nitrogen availability allowance could be as much as a 30 percent difference from one state to the next.
“The current land grant university nutrient availability algorithms are in the dark ages,” Joern said.
Joern added the current state-based approach is the result of history and nutrient management should move to a regional (and more flexible) model.
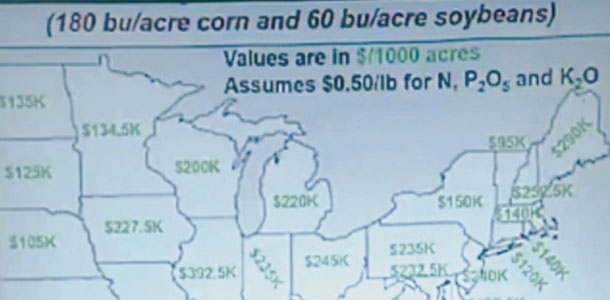
Using the example of a 1,000-acre farm with nitrogen, phosphorus and potassium at 50 cents per pound, state recommendations for Indiana are roughly $235,000 for the year. Illinois – literally next door – has a recommendation totaling more than $390,000 for the year.
“Illinois has better soil than Indiana. Their fertilizer recommendations should be half of Indiana’s. Can you imagine how much money people are spending if they are following the state recommendations?” Joern questioned.

Get with the program
To eliminate “state border magic,” as he put it, Joern suggested a regional model where information is soil specific and takes into account chemical and physical properties as well as landscape. Climate and cropping systems also need to be examined for recommendations to be successful.
On the farmer side, the entire process needs to be more user-friendly and lend itself to realistic farming situations. Specific build times do not allow for flexibility that can be critical.
“Especially this year, farmers do not have unlimited cash reserves to account for fluctuating fertilizer prices,” Joern said.
Improved computer software could lead to answers and solutions for better nutrient management. Considerations need to be made for fertilizer price, soil tests, build times and even the farmer’s budget.
Joern has created a software model that looks at soil moisture (rainfall) and soil temperature along with the farmer’s location, soil texture, soil pH and fertilizer protocol.
The output of the model predicts nitrogen crop uptake and shows the level at which the crop will no longer make use of applied fertilizer. To test the performance of the model, Joern collaborated with colleagues Dr. Jim Camberato, extension soil fertility specialist at Purdue, and Dr. Charles Wortmann, professor of agronomy and horticulture at the University of Nebraska – Lincoln.
“The model was almost flawless,” Joern said. “I can’t believe how good this is working.”
What’s next?
“In the real world, we are not farming 20 feet by 80 feet (like in a research trial). You are farming big acres and the topography is varied,” Joern added.
Preliminary testing of the model has been successful, and now different crops, soil conditions and climate are being tested.
With better tools to determine crop and soil fertilizer needs, removing policy barriers at the state level (and moving to more regionalized allowances) will be the real key to success with nutrient management plans in the future.
“We have to get farmers directly involved with research. When we get a grant (at the university) to study something, we are limited to that one thing,” Joern said. “[Farmers] can study what ever you want, when you want.”
“My idea is to create a research cooperative where a group of farmers and researchers use the software I’ve developed, and the resulting data helps everyone learn,” he added.
In addition to playing a role in the development of better tools, Joern encouraged farmers to visit Washington D.C. to help legislators understand nutrient management plans and how farmers use them to make management decisions that are good for the farm and the environment. PD
Maria F. McGinnis is a freelance writer based in Sun Prairie, Wisconsin.
PHOTO 1:Photo by Karen Lee.
PHOTO 2:Dr. Brad Joern is a recognized leader in nutrient management planning. He developed the Manure Management Planner (MMP), a software program supported by the National Resources Conservation and the Environmental Protection Agency.
PHOTO 3:Manure produced from the average 750-cow dairy is valued at more than $150,000 in terms of nutrient content.
PHOTO 4:State recommendations for nutrients vary dramatically from state to state. For example, a 1,000-acre farm in Illinois would purchase more than $150,000 more fertilizer than a comparable farm in Indiana. Photos by Maria F. McGinnis.


