If you take all the animals that currently have a proof of 57 kilograms of fat, for example, and found their real genetic value, there would be a bell-shaped curve around 57 kilograms of fat (also called normal curve).
We have a tool in genetics to figure out whether the normal curve is tight or wide around the proof of the animal. This is the proof reliability.
In this short article, we will define how to use the proof reliability to estimate the range in which the real genetic value of the animal relies and how to use this information to improve your animal selection quality.
Typically, genomic sires’ reliabilities are around 75 percent, which is lower than first-generation proven sires’ reliabilities that hover around 90 percent and second-generation proven sires’ reliabilities that may be as high as 99 percent.
As seen in Figure 1, the higher the reliability, the tighter the spread will be around the value of the proof.
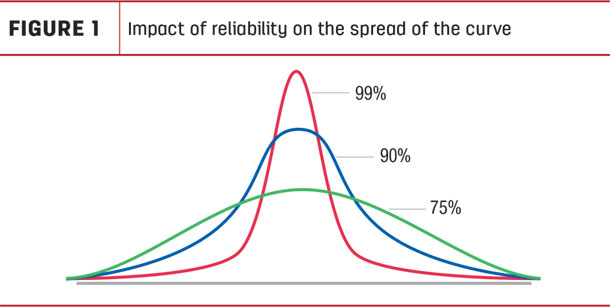
However, all three lines will never touch the “O” because proofs will never be 100 percent accurate. All three curves go to infinity on both sides of the average, so we can’t determine where it starts and where it ends.
What we can do, however, is to figure out in which range we have a 50 percent chance, 80 percent chance, 90 percent chance or whatever the odds in which the real genetic value will be.
We can find the range using a formula (see formula). But take note:
• You can find the reliability of every trait besides the trait or section of the trait on every proof of CDN.ca.
• The standard deviation for every trait on the Canadian proof is 5 (except for production traits, which are not publicly available at the moment).
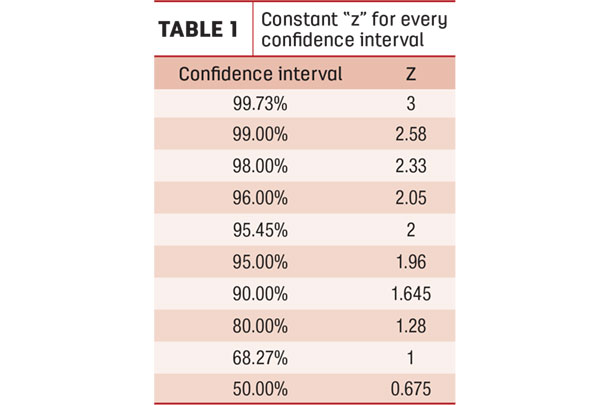
• The “z” is constant for every confidence interval. Table 1 shows the values of “z” for different odds of the real genetic value to be in a range.
Formula
Range = Proof value ± (√1 – Reliability * Standard Deviation * z)
Let’s experiment a bit. The part in between parentheses of the formula has already been calculated for you in Table 2. Now we have an easy way to calculate the range.
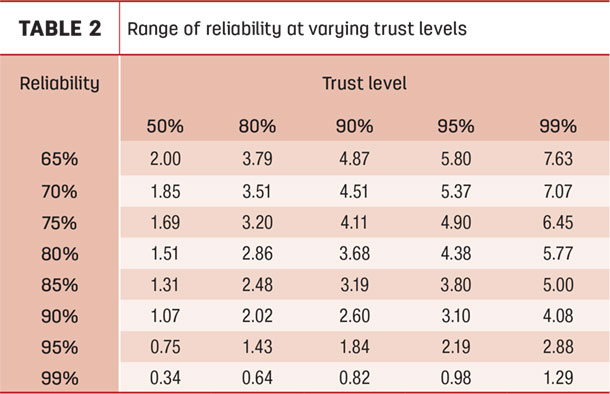
Let’s say we have a first-generation proven sire (Bobby*) at 13 for conformation and with a proof reliability of 90 percent. There is an 80 percent chance his actual genetic value is between 11 and 15, approximately.
Now let’s say we have a genomic sire (Carlitos*) at 16 for conformation and with a reliability of 75 percent. There is approximately an 80 percent chance Carlitos’ actual genetic value is between 13 and 19.
There is also approximately a 9 percent chance his actual genetic value is between 9 and 13, but there is also the same odds of his genetic value to be between 19 and 23.
Now let’s compare them and the bell curves of where the actual genetic value can be on Figure 2:
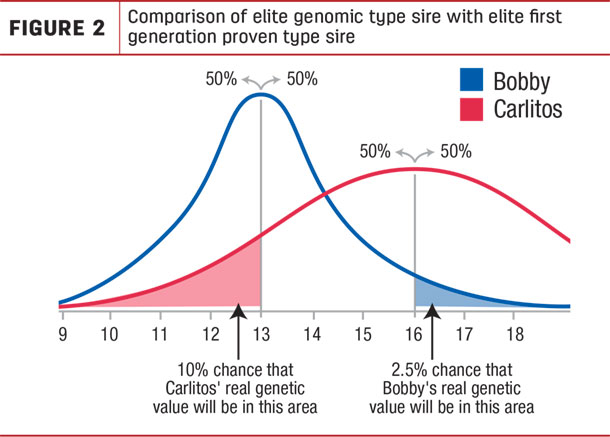
• There is approximately 10 percent chance Carlitos is lower or equal to 13 for conformation.
There is approximately 50 percent chance Bobby is lower or equal to 13 for conformation.
• There is approximately 50 percent chance Carlitos is higher or equal to 16 for conformation.
There is approximately 2.5 percent chance Bobby is higher or equal to 16 for conformation.
• There is approximately 10 percent chance Carlitos is higher or equal to 19 for conformation.
There is approximately 0.5 percent chance Bobby is higher or equal to 17 for conformation.
• There is approximately 0.5 percent chance Carlitos is lower or equal to 9 for conformation.
There is approximately 0.5 percent chance Bobby is lower or equal to 9 for conformation.
Of course, when comparing two bulls that have a similar proof for any given trait, it’s better to use the higher-reliability one. The bull with the higher reliability will be more consistent at improving what you want to improve in a correcting mating strategy.
The fact of the matter is: Because of genomic selection and generation intervals, the genomic sires are almost always better on some or all levels to the proven sires available.
So the question a lot of producers ask themselves is this: When am I significantly better off to choose a genomic sire over a proven sire?
There is a good reason I picked these two values for conformation in the two examples we compared. Both would be similarly ranked if you compare them to their respective groups of proven or genomic sires.
Also, 3 points on a 5-point standard deviation scale is where you’re almost always better off with using the genomic sire over the proven sire. This is clear in the previous examples.
A 2-point difference is a little bit trickier. Look at the other strengths of the animals compared to the potential mating. Of course, on average, the daughters of the higher-genomic bull should classify better.
However, if you’re really looking to correct something on your next generation of females from this mating, you may get more desirable results with a more reliable sire.
The trade-off of reliability for genetic gain is probably not important enough when there is only a 1-point difference between the two bulls.
This may be true when comparing two bulls on a single point of the proof.
There are many more criteria to look at for your selection on the proof and even off the proof, including the cow family behind the bull, the Good Plus and better percentage and the sire stack. ![]()
*Author’s note: These are fictional bull names that do not reflect any current bull among the top 400 conformation sires.

-
Nic Lalande
- Embryo and Product Support Specialist
- Ferme Blondin and Blondin Sires
- Email Nic Lalande


