
Although most producers have a good understanding of the concepts of dry matter, protein, starch, etc., some are unsure what a laboratory analysis report is indicating.

In the subsequent paragraphs, I hope to encourage producers to have a better understanding of these analytical reports.
Most producers understand the established concept of crude protein, but modern feed analysis reports will also report the availability of protein as a measure of its digestibility as well as different fractions of crude protein, including bypass protein, non-protein nitrogen, etc.
But what do these all mean? For this particular article, an example laboratory report is used in Figure 1.
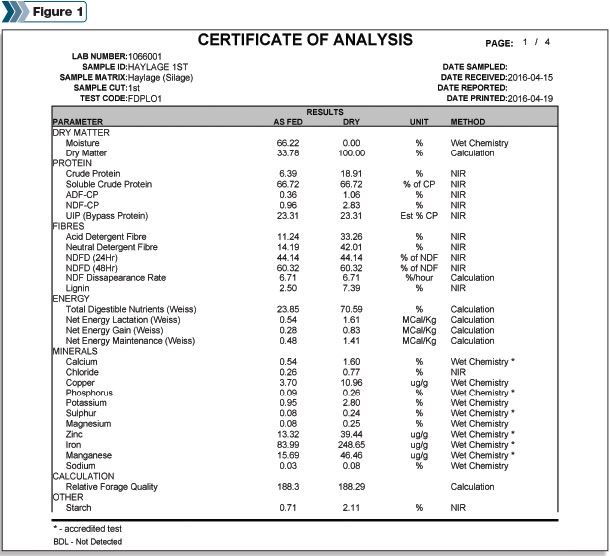
Although the layout of reports may be different between laboratories, the parameters indicated are included in most feed analysis reports.
Dry matter
Each report specifies the dry matter of the feed analyzed. This is the moisture-free material left after drying the sample in a laboratory oven.
The reason for obtaining the dry matter is because moisture dilutes the concentrations of the nutrients present, and it is standard practice to evaluate the feed and balance rations using a dry matter basis. For the remainder of this article, any numbers mentioned will be based on a dry matter basis for that reason.
Crude protein
Crude protein (CP) is calculated based on the nitrogen content of the feedstuff. Protein is made up of approximately 16 percent nitrogen and, in the lab, total nitrogen is measured and multiplied by 6.25 (100 / 16) to report it on a “crude protein” basis.
Generally, a corn silage sample will range between 7 and 9 percent CP and haylage 18 to 24 percent CP. What does this tell us?
Without looking at the type of protein it is made up of, it doesn’t tell us more than that it contains nitrogen, including both true protein that contains amino acids (the building blocks of protein) and non-protein nitrogen (like urea and ammonia that also contain nitrogen; urea and ammonia are compounds rumen microbes can use, but they are not directly used by the animal).
The report generally splits this parameter down further into soluble protein, acid detergent fibre CP (ADF-CP), neutral detergent fibre CP (NDF-CP), and undegradable intake protein, also known as bypass protein.
Soluble crude protein
Soluble crude protein is most readily available to animals. This consists of small amino acid chains, or non-protein nitrogen, that will solubilize in rumen fluid and be absorbed across the rumen wall.
Soluble protein is the same whether you look at the “as fed” or “dry matter” columns on the feed sheet because it is a percentage of the total crude protein.
Preferably, this number should be between 43 to 63 percent of the CP in corn silage and 49 to 67 percent of CP for haylage. Remember that the soluble protein content increases for corn silage as it ferments, so it is important to regularly test corn silage over time.
Bypass protein
Commonly called bypass protein, feed analysis sheets often report the fraction of protein resistant to degradation by rumen microbes. This fraction goes by a couple of other names, like undegradable intake protein and rumen undegradable protein.
This fraction of protein is often valued because it can be absorbed in the small intestine. Before going into the ADF-CP and NDF-CP, it is important to understand how ADF and NDF are composed.
ADF and NDF
ADF refers to the cell wall portion of the forage, made up of lignin and cellulose. The value is important as it relates to the ability of an animal to digest the forage; a higher ADF suggests a decrease in digestibility. NDF refers to the cell wall fraction that includes ADF and hemicellulose.
The NDF value is related to the amount of forage the animal can consume, and as NDF increases, the dry matter intake generally decreases. ADF and NDF for corn silage commonly range between 22 to 30 percent and 38 to 50 percent, respectively. For haylage, these numbers range between 30 to 39 percent and 39 to 50 percent, respectively.
ADF-CP and NDF-CP
The ADF-CP is associated with the portion of the CP unavailable to the animal as a result of heat damage. In forages, this can be natural heating of fermentation whereas for some feed ingredients, such as distillers grain, it is the actual heating process.
The preferred range is between 0.8 and 1 percent. Within this range, nothing deleterious has happened to affect the feed quality. Once elevated to 1.5 to 2 percent, overheating has occurred and could mean potential damage to the feed quality, making the feedstuff unusable to the microbes or to the animal.
NDF-CP is similar to ADF-CP, but it is less deteriorating to the feed because it has some digestibility associated with it. Usually, the NDF-CP is linked to bypass protein. Meaning that as NDF-CP increases, the more bypass protein you will have.
NDF, aNDF and aNDFom
On future laboratory reports, NDF will be specified as aNDF, where the “a” indicates that amylase, an enzyme, has been used for the NDF procedure. The next extension to that is the aNDFom, where the NDF is “ash-corrected.”
It differs from NDF and aNDF in that it is free of ash, which indicates its value on an “organic matter” basis, since ash is inorganic.
An ashing furnace is used to heat samples to extreme temperatures, leaving a residue of ash, which only contains the minerals. The ash is then weighed and subtracted from the NDF portion, giving the “ash-free” NDF or aNDFom.
Why does this matter? When the NDF is determined, residues of ash are often perceived as part of the NDF value. The variability between NDF and aNDFom varies, as some may have higher ash content due to splashing of soil on leaves from rainwater, areas prone to flooding or soil picked up during harvest.
Ash in haylage ranging between 7 to 8 percent indicates little contamination; 9 to 11 percent indicates contamination whereas above 11 percent is considerably problematic.
Corn silage ash content varies but generally is cut high enough that it contains limited amounts of ash due to soil contamination, with numbers ranging between 2.5 to 3.5 percent.
This extra step to obtain aNDFom may delay results but can be valuable to know when evaluating the feed. Ontario doesn’t see as much need for aNDF corrections as some other areas do.
However, nutrition programs are adopted from the other side of the border and often generate the same type of reports, and these numbers are needed to run the program correctly.
NDF digestibility (NDFd)
The NDFd24 and NDFd48 indicate the number of hours the in vitro digestibility ran to determine how digestible the feed source is. In other words, how much of the feed material has been digested by the bugs in the rumen fluid after a set amount of time.
For the NDFd24, a number in the 40s is preferred; however, the higher the better. This means that within the timeframe of 24 hours, more was digested and indicates that the feed is being used properly by the rumen microbes.
For NDFd48, a higher number is ideal as the test has now run twice as long. A number in the mid- to high 60s is preferred; some may even see values in the 70s. The NDF disappearance rate is the rate per hour and is based on an equation from Cornell University.
Energy
An equation is used to calculate energy or total digestible nutrients, since it is not a nutrient. Nevertheless, it is the first limiting factor for milk production. In the past, total digestible nutrients was based on ADF.
Since then, Bill Weiss at Ohio State University came up with a new equation, now called the “Weiss equation” or the “Ohio State equation.” This equation includes NDF, lignin, fat, starch, mineral and bound protein and is used to estimate energy values. Here, the NDF-CP is used as a correction factor and on reports is often noted by a subscript “*w.”
Lignin
Lignin is the indigestible portion of the plant cell, also known as the glue that holds everything together. This number will increase with the maturity of the forage and usually ranges between 2 to 4 percent for corn silage and 4 to 12 percent for haylage.
It is a good indicator of any digestibility issues, as lignin negatively affects the digestion of the cell wall by acting as a physical barrier to the microbial enzymes.
Net energy
Net energy lactation, net energy gain and net energy maintenance are listed on the report also, but in recent years they have generally been derived from all of the other components put into a ration-balancing program.
Generally, the net energy gain is always the lowest number of the three and should be a number greater than 1. It is looked at mostly by beef producers. The net energy maintenance is generally the highest of the three, although similar in range to net energy lactation.
Minerals
Minerals such as calcium, chloride, phosphorus, potassium, sulphur, magnesium and sodium are also listed. Calcium and phosphorus are generally the main focus for beef producers and generally follow a ratio of Ca to P of 2 to 1.
Monitoring and balancing for potassium level is critical in dry cow rations. However, since most minerals are added at the feed mill via a micro-pack, these are not as critical in the individual forage analyzed.
Relative feed value and relative forage quality
The relative feed value (RFV) to some extent is “old news.” RFV was developed by hay producers in central Canada and the U.S. Midwest years ago to market alfalfa-based hay.
It is not used much anymore but often still recorded on the certificate of analysis using ADF and NDF in its calculation. Although protein is not considered in the calculation, generally a higher RFV indicates a higher protein.
A RFV of 100 indicates it is decent-quality hay, whereas a RFV of 150 is exceptionally good hay. The challenge with this number is that it is OK to use when comparing alfalfa varieties to each other.
However, when comparing an alfalfa to a grass, the NDF has a much higher impact in the RFV equation. With fresh clippings of spring alfalfa, the NDF will be in the low to mid-20s whereas, at the same point in time, grass would be in the 40 percent range (Table 1).
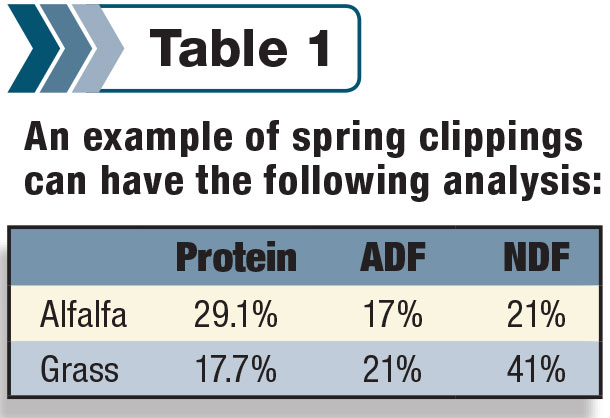
This seems fairly high but, in reality, the NDF of a grass doesn’t change nearly as much during the course of maturation as that of alfalfa. At harvest, a grass may have an NDF of 52 percent, similar to where an alfalfa will be at harvest. The value of NDF weighs three times as much as ADF in the RFV equation.
Note that there is not much difference between ADF and NDF of alfalfa in spring clippings. For this reason, relative forage quality has been created, which takes in to account the digestibility of forages.
Therefore, there is a shift towards using relative forage quality. For corn silage samples, however, the relative forage quality is not a valuable indicator, as corn silage is affected by the concentration of starch, which has a dilution effect.
Fat
Fat reported is a general term but is not really just fat and should be seen as an ether extract, which on some reports is called just that since it consists of waxes, cutins, etc. The range for ether extract on a corn silage sample analysis usually falls between 3 to 4 percent and 3.1 to 4.6 percent for haylage.
All report layouts and results will be slightly different. Growing seasons, timing of manure or fertilizer application, harvesting methods, timing and harvesting technique will all affect the nutrient availability of forages.
Laboratories update technology and continue to do their best to calibrate equipment; however, small variations may occur. Nevertheless, plenty of reliable information is available for a given sample to aid in precise feeding, allowing producers to meet the nutritional demands of the animal. PD
The author would like to acknowledge Ron Piett of A & L Laboratories for his contribution and providing a sample laboratory report for illustration purposes.

-
Anita Heeg
- Feed Ingredients
-
and Byproducts Specialist
OMAFRA
Email Anita Heeg


