As the U.S. farm economy slows, much attention has focused on farmland values. The questions of “if” and “how much” farmland values might soften are on everyone’s mind. Earlier this year, the USDA released its annual report on farmland values.

For 2016, the USDA reported the national average value for pasture values was unchanged from 2015. This was similar to the changes in cropland values, which were only slightly lower, or $40 per acre less, in 2016.
While these national averages are often cited, there are a couple of key details worth considering. Specifically, it’s important to consider how current pasture land values compare to historic levels and how conditions differ at the state level.
On average: The national trend
As previously mentioned, the USDA reported that pasture land values across the U.S. were, on average, the same as reported in 2015, or $1,330 per acre. It’s worth noting, however, that pasture values have been fairly constant since 2014, averaging $1,320 over the three years.
Looking beyond the last few years, pasture values have had an intriguing trajectory since 2000 (Figure 1). To put it simply, pasture values have gone from long periods (six or so years) of steady values to short periods (two to three years) with significant increases in value.
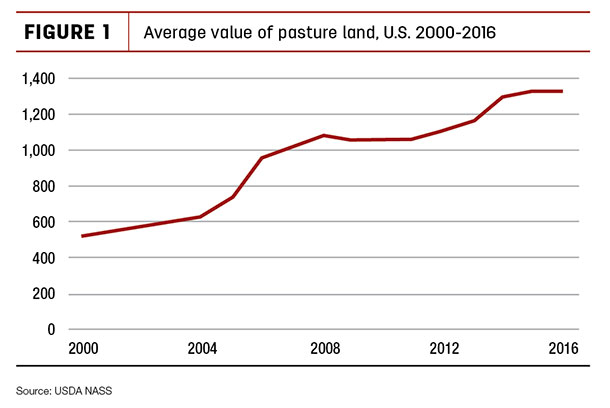
More specifically, pasture values from 2000 to 2005 held fairly constant with a six-year average value of $606 per acre. In 2006, pasture values began to climb to a holding pattern of nearly $1,100 per acre from 2007 to 2013. Values then recently climbed to around $1,300 per acre.
This pattern is important to note as it describes how pasture values, since 2000, have increased. While average pasture values increase at average annualized rate of 6 percent, the majority of this increase in valuation occurred in just a few years.
Large difference at the state level
In addition to the national trends, state-level changes of pasture values were quite variable in 2016 (Figure 2). Like a bulls-eye, Kansas stands out for a couple of reasons. First, pasture values in Kansas dropped by more than 7 percent (2016 compared to 2015).
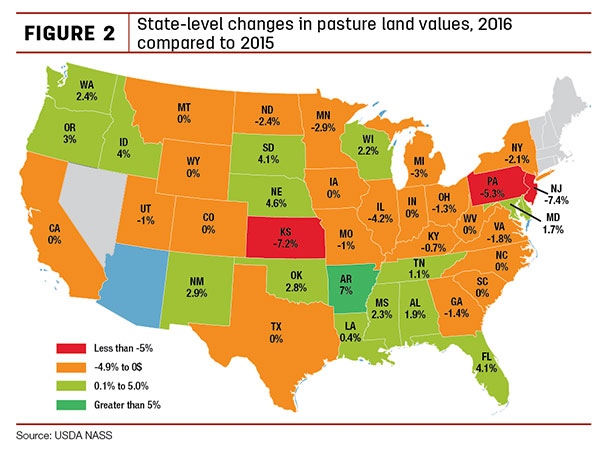
Not only was this drop quite different from the national average, it’s significantly different than the surrounding states. Nebraska, as an example, reported pasture land values of nearly 5 percent higher.
Regionally, it’s worth noting that pasture values in the southeast U.S. were generally stronger. Florida, Alabama, Mississippi and Tennessee all posted increases in pasture values. On the other hand, values in the Northeast – Pennsylvania, New Jersey and New York – were lower and quite soft.
Wrapping it up
While many noted pasture values were unchanged at the national level, a couple of trends are important to keep in mind. First, across the U.S., pasture values have experienced several years of stable values followed by rapid adjustments. With that said, the 2016 pasture values are essentially a continuation of the holding pattern that began in 2014.
Second, pasture values at the state level were actually quite variable. Pasture values in Kansas were sharply lower, while other Plains states (South Dakota, Nebraska and Oklahoma) reported an uptick in values. Just as the results vary by states, changes in pasture values are also likely to vary – sometimes greatly – at even the county level. ![]()
David Widmar is an agricultural economist specializing in agricultural trends and producer decision-making. He is the co-founder of Agricultural Economic Insights LLC and a researcher in the Center for Commercial Agriculture at Purdue University. Follow David on twitter.

-
David A. Widmar
- Co-founder
- Agricultural Economic Insights LLC
- Email David A. Widmar