


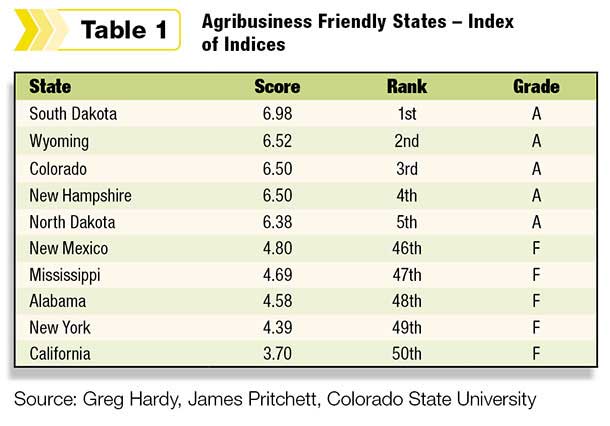
The report ranks states in four different categories of agricultural production: agricultural inputs, crop production, meat and livestock products, and first-level agricultural processing.

States ranking highest on the four categories of ag rankings were South Dakota, North Dakota, Wyoming, Colorado and New Hampshire. California, Alabama and New York ranked consistently in the bottom for all four categories.
The study originated years ago when Hardy was on the faculty at Oregon State University, as that state considered increasing its corporate income taxes.
“Individuals within the agribusiness sector were very unhappy about it, they thought it would hurt their ability to compete with other agribusinesses in other states,” Hardy said.
But as economists weighed how tax increases would affect Oregon jobs and employers, agriculture didn’t have such a clear picture. Business-climate and job production indices are common in the world of economic development. But not so much for businesses related to agriculture.
“What we were able to process and identify were a number of business friendliness or business competitiveness indices,” Hardy said. “We said these are interesting and useful. But agribusiness is kind of a different animal because of the nature of the resources and the activities involved there. I determined at that point we ought to really find the means to put together a study like this that focuses on [the] agribusiness sector.”
Hardy then joined Pritchett at CSU and began the project by brainstorming other variables they were aware of. Grad student Ryan Mortensen helped pull data affiliated with agribusiness infrastructure and policy. Using 38 different variables, the rankings separate factors into regulatory policy, taxation, government efficiency, and key government services.
They then presented their results to a panel of agribusiness representatives from around Colorado, and gathered suggestions.
Feedback eventually showed that putting all 38 variables into one single study wouldn’t do justice to the variety of ag industries.
“The first-level processing is quite different in terms of the things that matter to them, versus what matters to a cattle and livestock operation, and what matters to crop farms,” Hardy said. “So we ultimately decided we ought to divide this into four different indices and focus on what’s different to those four indices.”
Factoring friendliness
For each of the four overall rankings, data and categories range in how they are weighted. For instance, conservation easement acreage has different significance for meat and livestock operations than it does for first-level ag processing operations.
Land availability was another factor showing some differences in the portion given to each category.
“That one is basically the percentage of privately owned land relative to the total land mass,” Hardy explained. “That number is going to go down in the West where there is a lot of publicly owned land, compared to Connecticut, which has almost no publicly owned land.
“If you talk to agricultural and livestock owners, they’ll tell you it’s a frustration to them that so much land is tied up in the public sector in Western states. They, by and large, view that as a negative.”
Business climates for each state include factors linked to energy prices, political initiatives, and labor availability.
The latter, Hardy explained, is determined by unemployment rates in rural areas, the idea being “if there’s a lot of unemployment, that’s a labor force that’s available at a lower cost to help agriculture production activities than if labor is scarce and unavailable.”
On the meat and livestock side, state and estate tax policy also made a significant pull for some states over others. Montana climbed into a top 5 ranking for meat and livestock agribusiness based on its strong support in those areas.
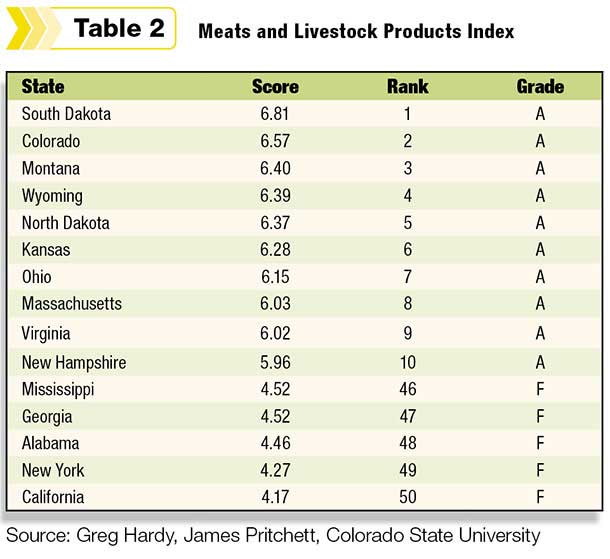 “Certain states give tax benefits to livestock sector, in particular on depreciation or sales tax,” Hardy said. “We didn’t have time to burrow down to that level very heavily. As we find some points for this going forward, those are things we’d like to dig into.”
Another one like the tax issue is water policy. As water scarcity grows through much of the country, irrigation law carries more significance in the ability to attract or retain businesses rooted in agricultural production.
Overall analysis
Hardy said the study will hopefully have more longitudinal data in the future with updates made every few years. But the rankings already reveal some regional trends.
Hardy said he was most surprised how the most competitive and agribusiness-friendly areas “all tended to be Upper Great Plains” of the Dakotas and Wyoming, and not the major ag states such as Texas or Iowa. New England also had a stronger showing, although more on the first-level processing and ag input sides.
“It seems to me they are putting together policies that are favoring processing steps, so the value is added, to basic agriculture but not being so favorable towards agriculture itself, or the production processes of agriculture.”
Hardy hopes the rankings provide states a tool for economic development to recruit more agribusiness to their states.
“But for those who do not rank high, there’s also an importance because you’ve got all these variables that go into this index, (and) you can start to drill down and find out why California ranks 50th and what are the things that are holding California back from a policy perspective.”
The rankings should provide those states with tools needed to lobby their political leaders to change course and show how agribusiness can be preserved in their respective state. “They can use this as leverage and information and education in the policy forum and making laws and regulations that are not so onerous to agriculture.” ![]()


