


Pests suck. Some pests literally so. They are an eyesore, they cause unpleasant conditions for you and your herd, and they can cost you money. However, it can be difficult to determine whether or not the steps we take to eliminate pests are profitable. Once you’ve controlled for a pest, you never really see what the outcome would be had you not treated – and if you never treat, you don’t see the flip side of potential returns from treatment. So how do we know that what we are doing to prevent high pest levels is working?

The method we have to use when evaluating the financial returns from pest control is a comparison of the value of estimated additional gain realized against the cost of our pest management strategy. This requires us to develop two estimates: the cost of a pest management strategy and the implied gains from eliminated pest pressure. Since horn flies are widely distributed across the U.S. and recognized as a financially significant pest, we’ll use them in an example of this comparison.
First, we can estimate the cost of a fly population management strategy. Based on standard practices in an area experiencing moderate to heavy horn fly pressure, we’ll evaluate the use of a pour-on insecticide, an eartag and a feed-through insecticide used at manufacturer-recommended doses simultaneously. Table 1 presents the estimated cost in dollars per head of each pesticide used. I found each of these costs online for several different products of each type and came up with an average price per dose.
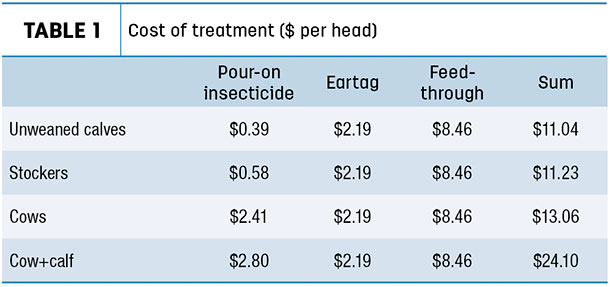
We’ll compare costs and returns for this pest management treatment on calves sold at weaning, about 205 days, stockers we own for about four months and cows we own year-round. These ownership periods are important for determining the number of each treatment we are paying for. We’ll assume that all animals are tagged once a year and each animal is provided with feed-through insecticide continually via inclusion in a mineral feeding.
Finally, I’ve adjusted the cost of pour-on insecticide based on the volume required per head per year. Cows will require pour-on treatments twice, while we’re only using the pour-on once in calves and stockers, each because we own them for a shorter period. You can consider different prices and strategies than those in Table 1 depending on pest pressure in your area, and product choice and price.
Using research conducted at New Mexico State University, we know there is significant unrealized (or lost) gain in the presence of uncontrolled horn fly populations. An excessive number of flies causes changes in behavior and the physiological state of cattle, and both result in decreased average daily gain (ADG).
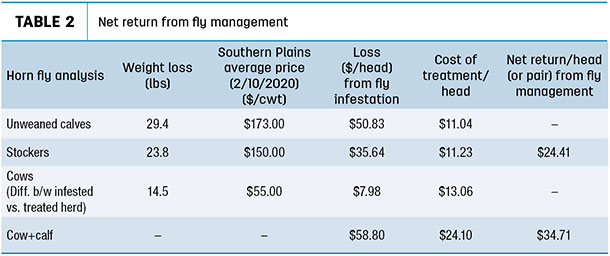
We’ll consider two examples: a stocker enterprise and a cow-calf enterprise. In calves, heavy horn fly infestation leads to ADG loss of 0.2 pound per day. In stockers, the same infestation leads to ADG loss of 0.09 pound per day. In cows, the difference in weight between infested and treated herds was approximately 14.5 pounds per head in the data from New Mexico State. Using these changes in weight, we can estimate total value lost in the presence of heavy fly pressure.
For our examples, we’ll assume a weaning date of 205 days for calves. With a decrease of 0.2 pound per day in ADG, total unrealized gain per calf due to horn flies prior to weaning is approximately 29.4 pounds. Total lost gain for stockers over 4 months is approximately 23.8 pounds.
Both the stocker and cow-calf enterprise realize a positive net return from implementing pest management practices. To put the total amount in perspective, if you run a 50-pair herd, your total net return from fly management under these conditions would be a gain of approximately $1,700; that is the same as selling 2.5 more 400-pound weaned calves. In a herd of 50 stockers, your total net return from fly management under these conditions would be approximately $1,200, the same as selling an additional stocker.
Table 2 only presents the net return for the total value per head from our theoretical fly management strategy, i.e., what you would see on a balance sheet.
The cow-calf return changes a bit when viewed from a cash-flow standpoint. While increased cow weight is positive for total net worth, that value is only realized when cows are sold. If we adjust the figures in Table 2 to incorporate a 10% culling rate each year, our net return per head to the cow-calf enterprise from fly management decreases from $34.71 per pair to $27.53 per pair – still a positive net return. Whether you view the choice from a balance sheet or cash-flow standpoint, management for horn flies tends to pay under the management strategy we’ve presented.
If you are choosing to treat either your calves or your cows under fly pressure, a cash-flow analysis would likely show higher ending cash from treating the calves in a herd rather than cows. We’re paid on calf weight each year and only paid for cows when they are culled. Achieving more pounds of gain on calves by keeping flies off of them will be more positive for annual cash flow than keeping pests off of cows.
From this brief example, you can see pest control can certainly pay. The amount of weight lost due to different types of pests and building a pest management plan are things you can work through with your local extension specialists. However, pest management does not only protect us from reduced gain. Insects are also vectors of a number of diseases and pathogens. Implementing a pest management plan protects from low-probability but high-impact events, such as disease outbreak from an insect vector.
When weighed against the cost of lost animals, paying for disease treatment and the potential for dealing with quarantines depending on the disease and location, these simple measures of preventing the presence of insects yield even higher net returns to any operation.


