
From previous articles in this publication, we have learned that financial statements are necessary to monitor the financial health of an ag business, and that all statements should be completed in a timely manner. The essential financial statements are the cash position, the income statement and the balance sheet. I have also shared that the balance sheet is the most telling of all financial statements although none of the statements are purposed to be stand-alone documents.

A couple of other thoughts presented in the past articles are that ag production operations are businesses, the business of ag production is not dissimilar from other businesses, and the urgency of ag production may take precedence over some of the business functions of the entity.
Having presented those thoughts, it is recognized by all observers that ag production is increasingly more complex in terms of management, and urgency of tasks has escalated versus previous times.
Let’s simplify part of the financial management task today. Here is the shortened version of understanding financial statements (principally the balance sheet) and what they are telling us. This approach is for producers, not accountants. I recognize in some tax code or generally accepted accounting principles (GAAP) accounting textbooks there may be an exception to this presentation. However, this information will apply to 99% of producer situations.
Balance sheet components
The balance sheet is comprised of three primary parts. On the left-hand side of a balance sheet is an itemization of what a producer owns. These are assets. On the right-hand side of a balance sheet is an itemization of what a producer owes against what he owns. These are liabilities. Also, on the right-hand side of a balance sheet at the bottom of the sheet is a number that is left over. This is the net worth or earned equity. I refer to this section as net worth. This net worth is mathematically defined as the total assets less the total liabilities. In simple terms, it is the amount of cash one would possess or have left over if all the assets were sold and all the liabilities were paid from those proceeds.
A very good businessman with minimal formal education referred to his net worth as his “accumulation” from his work efforts. I refer to the net worth part of the balance sheet as the gold section, and the purpose is to accumulate more gold over time. Also compared over time, the net worth can identify operating profits at any given time in a production cycle. For me, that is why the balance sheet is the most useful of all the financial statements. We’ll talk more about accumulating gold later. There are other sub-parts of the balance sheet that inform us about the health of the business as well.
On the asset side of the balance sheet, the assets are divided into three sections. Each asset is listed in order as the first to be converted to cash to the last to be converted to cash. This is the order of liquidity. Simply stated, financial liquidity is how fast some asset can turn to cash. The first of the three sections of assets is the current asset. These are assets that will convert to cash in a year or less. These assets include cash, accounts receivable, inventory, crops in progress, market livestock or the current portion of a note receivable, as examples.
Example
In our example balance sheet in September 202A, Hay Dude had $237,700 in cash (Table 1). This was the day after he sold his hay crop.
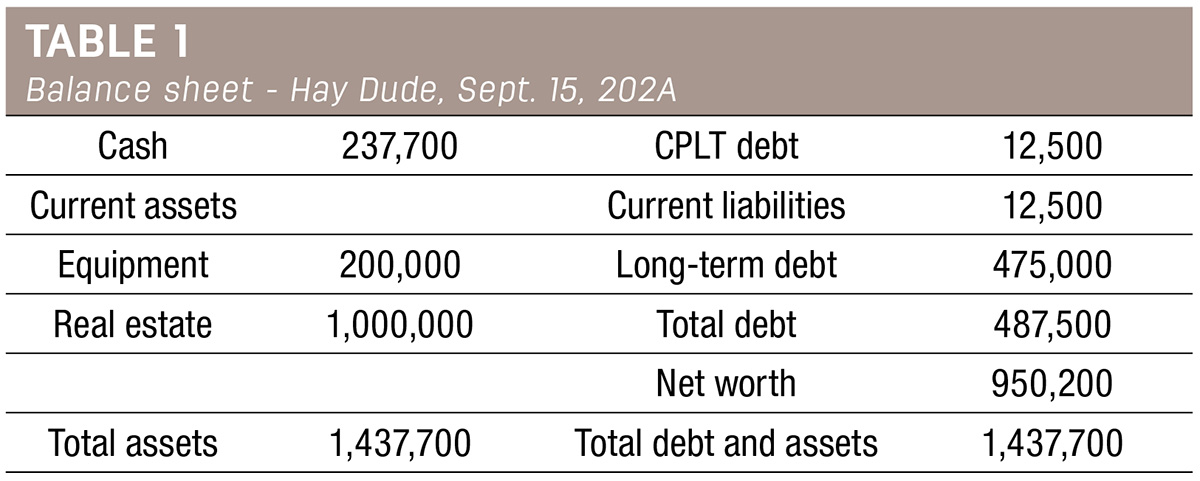
The day before he had no cash and 1,500 tons of hay in the stack for sale. So the hay was the first asset to convert to cash and it is listed at the top of the balance sheet only because Mr. Dude didn’t have cash on hand. Because this part of the balance sheet deals with cash, I refer to it as the green section. One can never have too much cash or be too fit. While it is good to forecast cash positions, it is relative in terms of what cash will be used for. At the same time, cash usage in an ag business is the right-hand side of the balance sheet or current liabilities.
The current liabilities section of the balance sheet is, conversely, those items that will require cash to pay them to a zero balance in the next year. Those items are accounts payable, current portion of term debt payments, operating lines of credit or accrued expenses. The cash usage in the September balance sheet is $12,500.
Just as cash is king, the use of cash takes away from a king. For this reason, I refer to the current liabilities as the red section. This one section can stop your business if it takes up all the available cash. One part of the current liabilities that can be controlled to some degree by the producer is the current portion of term debt.
Current vs. intermediate vs. long-term
A comparison of current assets to current liabilities indicates to a producer their working capital position. Simply put, working capital is how much cash now or in the next year (current assets) is or will be available to pay off or retire the payables (current liabilities) over the same period. Working capital is measured in both amount and percentage. Again, in producer terms this is how many assets are going to convert to cash in the next year and how much of that cash will be required to pay bills in the next year. Referring to the September balance sheet, Hay Dude had $237,700 of current assets after he sold his crop and paid the bills for the current year. At that point, he had only the next year's term payment to make in the amount of $12,500. So his working capital is $225,200, and his current ratio is 19-to-1. This working capital position is exceptionally strong and not the usual in ag production. A positive position is the goal, and more than a 4-to-1 positive position ($4 of current assets to $1 of liabilities) is generally a luxury.
The intermediate assets and intermediate liabilities compare in similar fashion. Intermediate assets are assets that will last over several years but not a lifetime and contribute to production for those years. In the production effort these intermediate assets hopefully convert or produce a current asset (crop inventory or account receivable) that ultimately converts to cash that will pay current liabilities. The intermediate liabilities are typically liabilities used to finance those intermediate assets. Those would be tractor loans or loans to purchase brood cattle as examples.
The third section of assets on the left-hand side of the balance sheet is long-term assets. Those are assets that will contribute to the production process for several years. Land or a farm shop building are examples of that asset class. By function, one could argue that a John Deere 4020 tractor is a long-term asset; however, it falls into the class of intermediate assets for other reasons.
The long-term liabilities that match up with long-term assets are mortgage liabilities.
With these classes of assets, the liabilities should match up with the life of the asset. For example, a stack of hay for sale is not financed with a mortgage on the farm. At the same time, a ranch is not paid off with a one-year operating line of credit. This balance of liabilities to respective assets is called debt structure and is critical to financial management of the ag business. Proper debt structure can simplify life for an ag producer and, conversely, improper structure can complicate life.
Beyond working capital, cash forecasting and debt structure, the crucial indication to gain from the balance sheet is the direction and velocity of gains or losses in net worth. As stated earlier, net worth is defined as total assets minus total liabilities. Two goals are desired from this equation. The first goal is that one owns more than they owe. Hopefully, total assets minus total liabilities leaves a positive number.
Secondly, that positive number should grow year over year as both a raw number and as a percentage. That growth indicates all the chores performed in the dark pre-dawn hours, the hot summer days sweating in a saddle, the long days hauling harvest to market and getting covered with dirt, dust, grease or cow splats resulted in an operating profit.
Over time, that growth identifies an operating profit season over season and from one period to the next. The season or period can vary in duration but probably does not coordinate with a calendar year or a tax year. That is why the balance sheet is a little more informative than tax returns or profit and loss statements. Also, that is why an operating profit can be identified at almost any time in the production cycle.
If a producer has an accurate financial statement of Dec. 31 of year A and year B, the producer does not have to wait until tax day in year C to determine what the operating profit for year B was. The comparative balance sheet identifies that profit at any point along the way.
Knowing what the score is for each inning or quarter of the ag production game is invaluable for producers. This knowledge can modify the game plan at timely intervals, hopefully without adversely affecting the outcome.
Tentatively, in January 2024 at the Idaho Farm and Ranch Conference, we will talk more about the importance of financial statements in a formal presentation and a workshop with ample question-and-answer opportunities. Contact your local extension office for specific dates, times and location.


.webp?height=auto&t=1783636475&width=285 "63802-Thomas-GPS-equipment--Automated-Magnum-Tractor--Matt-Skinner-photo(1).jpg")
