

As we walked among the ringing and flashing slots to our next meeting, smoke and the occasional outburst of a fortuitous (or not so fortuitous) patron hanging in the air, I couldn’t help but be reminded of a story a friend shared some years ago. Braggadociously, he described to me a lucky evening in front of a video poker machine. Tales of a straight flush, a suitcase full of cash and a security escort filled the narrative.
Despite the glamorous story my friend wove, what he failed to mention was the sheer volume of currency he had fed into the machine leading up to his victorious exit. In the dairy industry, I feel we sometimes fall victim to the same misconstrual when we zero in on the outstanding levels of milk production we achieve yet activate selective amnesia as we overlook or fail to mention the inputs that got us there. This is why the metric of feed efficiency (FE) is so important when evaluating the success our operations are able to achieve.
Dry matter intake
Feed efficiency begins with one of the most essential measurements to nutrition on the dairy: dry matter intake (DMI). In order for your nutritionist to put together a successful feeding program, he or she needs to have a clear understanding of just how much the cows are eating. There is only so much “space” in a ration to provide the nutrients required to support target production, and this is determined by how much the cows are physically consuming.
First, accurate forage dry matters, either performed on-farm or provided by the forage lab, are necessary in determining DMI and FE. A sudden swing in the dry matter of a forage can be misleading, as the total as-fed weight the cows have consumed may have changed while the dry matter consumed actually remained consistent.
Weekly “drydowns” are advisable and can make a big difference in delivering consistent nutrition to the cows. Larger dairies feeding forage from bags should take particular caution because of the nature of how these are loaded and fed out; every few feet may represent a different load of feed from the field and may contribute to inconsistent dry matters during feedout.
In contrast, some variation is mitigated when these loads are layered into a bunker silo. When harvesting into a bag, it may be prudent to mark the outside of the bag with spray paint when moisture levels have clearly changed; in this way, you give yourself and your nutritionist a “heads up” when you are approaching a significant change.
Second, measuring feed refusals is another essential component of understanding DMI and FE. Feeding software makes this task easier and more accurate if collecting and weighing refusals fits into your feeding strategy. Logistically, physically weighing refusals for every pen may not be feasible for some producers due to time or labor constraints. One option for quickly estimating refusals is to place a clipboard in the skid steer or loader and have the person responsible for clean-out record the number of bucketfuls per pen collected that day. If you know the approximate weight of a bucketful, refusals by pen can easily be entered into the feeding software or used to calculate DMI later.
Energy-corrected milk
The second component involved in calculating FE is energy-corrected milk (ECM). Feed efficiencies are sometimes expressed with milk yield alone as the numerator; however, using ECM provides a more representative valuation of efficiency, as milk yield is normalized relative to component percentages. For example, it requires more energy from feed to make 90 pounds of milk with a 4 percent butterfat and a 3.2 percent protein than 90 pounds with 3.3 percent butterfat and 2.9 percent protein – this difference is lost if we express FE on milk yield alone.
ECM considers the energy required to attain milk yield with given component percentages, then converts to the pounds of milk this would equate to if producing 3.5 percent butterfat and 3.2 percent protein. Energy-corrected milk is calculated as follows in Table 1.
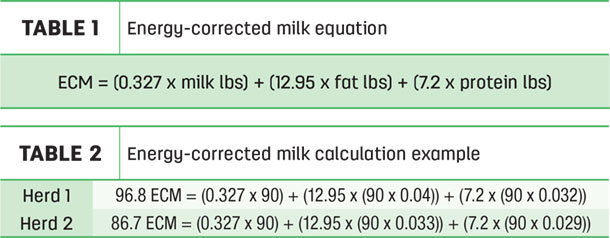
In the previous example, a dairy with 90 pounds of milk with a 4 percent fat and 3.2 percent protein would be making 96.8 pounds ECM, while the dairy with 90 pounds of milk and a 3.3 percent fat and 2.9 percent protein would be making 86.7 pounds ECM (see Table 2).
In order to understand the complete picture of FE, we need to incorporate components into the equation so we don’t negate the energetic value of components in milk. Back to the casino anecdote: The story changes if my friend’s suitcase of cash was filled with pesos instead of dollars.
Putting it all together
With accurate DMI and ECM, we are now capable of calculating FE with the basic equation in Table 3. FE is expressed as a ratio and can simply be thought of as how much ECM is being produced per unit of DMI. For example, let’s assume the herds described above are both averaging 58 pounds of DMI (see Table 4).
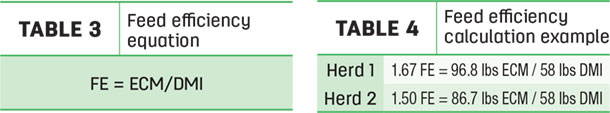
Even though both herds were producing the same pounds of milk at the same DMI, we see that the ECM of the herd with the higher components made them significantly more efficient.
In a real-world example, a client of mine had ventured into making some excellent BMR and low-lignin alfalfa one crop year. As we transitioned from conventional forages to these highly digestible variants, we all celebrated as we approached near 100 pounds of ECM. Our celebration was premature, however, as we began to notice DMI climbing up over 70 pounds in some pens.
Due to the highly digestible nature of these feeds and the physical form of the ration, cows were able to consume more and more with increasing rates of passage and consequently lost out on some of the nutritive value of the ration – the result being a less-than-desirable 1.43 FE.
Fortunately, we were able to slow rate of passage with some modifications to the ration, regaining control of DMI, all while maintaining production and therefore improving FE. Without considering FE, it would have been easy for us to get caught up in the accomplishment of 100 pounds of milk while overlooking the cost to get us there, just like my friend in the casino.
Evaluating feed efficiencies
Due to varying intakes and production across stage of lactation and parity, normal FE ranges may differ depending on which group of cows you are considering. For example, fresh cows will typically have higher FE compared to whole-herd average as intakes lag behind production during negative energy balance at early days in milk. In fact, FE may even be used as an indicator of potential metabolic problems in fresh cows if too high (greater than 1.8), as cows may be relying more on body reserves to meet the demands of increasing production rather than achieving adequate intake.
Late-lactation cows will have lower FE compared to whole-herd average as intakes have caught up to production and milk yield tails off. If evaluating FE for individual groups of cows, it is important to consider their stage of lactation.
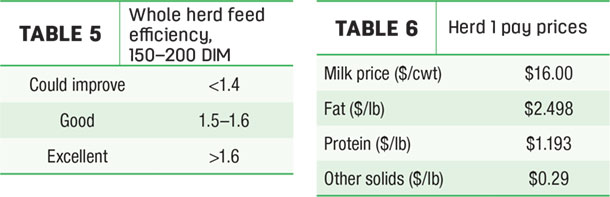
Whole-herd evaluations of FE are more straightforward as we consider an overall average across stages of lactation. Table 5 shows some general recommendations when evaluating whole-herd FE.
Money-corrected milk: A different perspective
As FE incorporates the energetic value of milk components via ECM, another metric, money-corrected milk (MCM), incorporates the financial value of components. MCM is unique in that it provides economic perspective to production performance and can be specifically applied to individual farms based on pay prices.
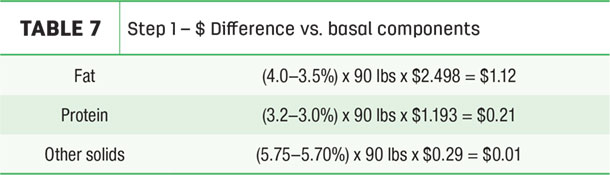
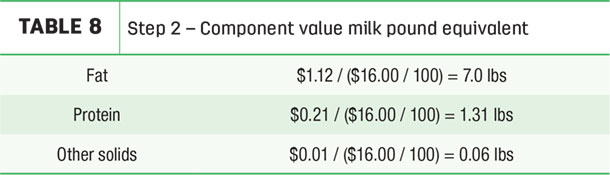
MCM is derived by comparing actual butterfat, protein and other solids to basal values of 3.5 percent, 3 percent, and 5.7 percent, respectively. First, using the producer’s pay prices for milk components individually, the dollar value of the difference in actual versus basal value is calculated. Second, the dollar value of these differences are converted to pounds of milk based on total milk price per hundredweight. Finally, the milk pounds derived from the value of components are added to milk pounds per cow.
Let’s refer back to Herd 1 in the ECM example to demonstrate how MCM is calculated, assuming Herd 1 is producing 90 pounds of milk with 4 percent butterfat, 3.2 percent protein and 5.75 percent other solids (see Tables 6, 7, 8 and 9).

Based on how Herd 1 is paid, in addition to making excellent components, we find they are producing 98.4 pounds MCM over bulk tank average of 90 pounds. If we work through the same math for Herd 2, which was also producing 90 pounds of milk but with 3.3 percent butterfat and 2.9 percent protein, assuming the same pay prices, we find Herd 2 is producing 86.6 pounds MCM. Because Herd 2’s components are below the basal component values used to calculate MCM, their 90-pound average is discounted, representing the economic loss of lower components on a milk pound equivalent.
MCM is another insightful metric that effectively demonstrates the economic significance of milk components and the impact of milk pay prices thereupon. Continuing with the casino analogy, a straight flush for my friend would have yielded much different results at the nickel versus the penny machine.
In summary, we have a handful of different tools at our disposal to evaluate production performance from a variety of perspectives. FE can be a powerful metric when assessing herd performance, as it improves our understanding of how well cows are utilizing the “inputs” we are providing. MCM contributes additional insight into specific economic impact of production performance at the farm level. So the next time you’re discussing production with your nutritionists or other producers, remember to consider: “Are you telling the whole story?” ![]()
ILLUSTRATION: Illustration by Kristen Phillips.
Bob Biedenbach is a dairy nutrition consultant with Standard Dairy Consultants. Email Bob Biedenbach.
Standard Dairy Consultants provides nutritional and management consulting services and is a division of Standard Nutrition Company. Standard blends custom dairy mineral and vitamin supplements with facilities in Iowa, Washington, Idaho and Texas.

-
Chad Jenkins
- Dairy Nutritionist
- Standard Dairy Consultants
- Email Chad Jenkins