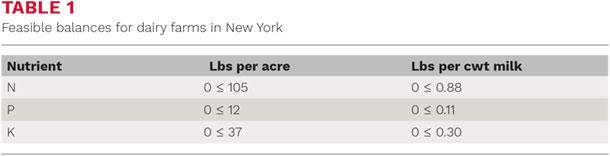
Similarly, feasibility ranges are needed for whole farm nutrient mass balances (NMBs) as a key performance indicator of nutrient use efficiency at the whole-farm level. In New York, such targets, or feasible balances, were determined for the NMB per acre cropland and the NMB per hundredweight (cwt) of milk produced, based on NMB data from 102 New York dairies.
Feasible balances per acre were set at the third quartile of the farm distribution. In other words: if three out of four New York dairy farms operate at or below this NMB, it should be feasible for the fourth farm to also do so. For the balance per cwt farms were divided in two groups, those below and those above, the average balance per cwt for all farms. The actual feasible balances that resulted from this are in Table 1.
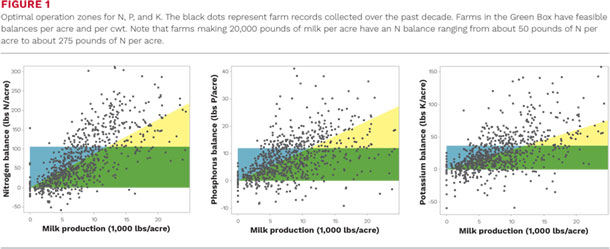
Farms that operate in the feasible ranges for both balances (per acre and per cwt) are said to be in the optimum operational zone or “green box”. This is shown in Figure 1 for all three nutrients.
Click here or on the image above to view it at full size in a new window.
The Green Box figures allow for a quick indication of a farm’s sustainability. Long-term records from a number of farms indicate that balances can be maintained in the Green Box for many years in a row.
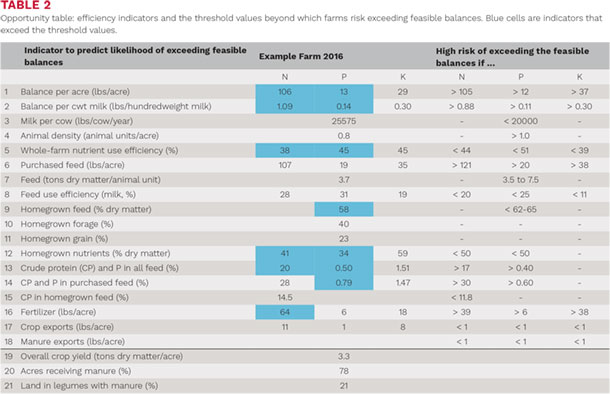
Because there is information on the crops and nutrient amounts grown on-farm as well, the NMB assessment can provide efficiency indicators beyond the actual whole-farm balances and Green Box concept. The additional key performance indicators can give insight why a farm operates within or outside the green box.
For most of these indicators, a threshold value is derived. Should a farm cross this value, it is likely that it will operate beyond the feasible balances. This way we can indicate where the farm is likely to have the largest opportunities to improve the balances. In the example below (Table 2) the “Example Farm” has high N fertilizer imports (64 lbs/acre) which may have contributed to a N balance that slightly exceeds the feasible range.
Click here or on the image above to view it at full size in a new window.
The N imported through purchased feed (107 lbs/acre), however, is not crossing the indicator. This suggests that this particular farm may have more opportunities to reduce the N balances by re-examining fertilizer use, than by evaluating dairy rations and decreasing feed imports.
Although this table of indicators gives a general indication of where improvements in nutrient management can be made, it does not provide a detailed and guaranteed protocol to increase production with fewer nutrients. To make improvements in farm management, the NMB results need to be discussed with the farm’s nutritionist, crop specialist and planner.
Collaboration among these experts can provide a level of detail that is lacking in the NMB assessment itself. For example, this farm may have higher N purchases because they have poorly drained soils, leading them to grow more grass hay, which responds to available N from fertilizer. Or perhaps they are supplementing corn with sidedress N because of less efficient manure use.
The Green Box figures, the Opportunity Table, and the trend figures for farms with multiple years of data make NMB information easy to interpret. In addition, the information needed is relatively quickly obtained if records are kept throughout the year. A companion article shows how some producers have adjusted recordkeeping to streamline the process.
Multiple years of NMB assessments help evaluate the impact of management changes on balances, while also helping filter out effects of dry or extremely wet years with below-average yields, which may necessitate larger feed imports, and would thus result in higher balances.
In New York, a field-specific adaptive management approach to N management for corn was put in place by the partnership of the New York State Department of Agriculture and Markets (NYSDAM), the New York State Department of Environmental Conservation (NYDEC), the New York State Natural Resources Conservation Service (NY-NRCS), and Cornell University in 2013.
The approach allowed farmers to increase N applications for corn beyond the foundational guidelines of the land grant university, as long as actual yields are recorded and the corn stalk nitrate test (CSNT) results of the fields that received the elevated N rates is managed below 3,000 ppm over time. The adaptive management process was revised in 2018 and now includes the statement: “Dairy farms that have whole farm nutrient mass balances (NMBs) with N balances of 105 lbs/acre or less, and that maintain a three-year running average N balance at or below 105 lbs/acre, meet the adaptive management guidelines and do not require additional field-specific evaluations beyond recording yield.”
This addition to the adaptive management approach recognizes the value of on-farm evaluation of practices to find better management approaches and the need for flexibility in field management as every farm is unique, as long as key whole-farm performance targets are met. ![]()
Mart Ros is with the Cornell Nutrient Management Spear Program. Email Mart Ros. Karl Czymmek is with the Cornell Nutrient Management Spear Program and Cornell CALS PRO-DAIRY. Email Karl Czymmek. Quirine Ketterings is with the Cornell Nutrient Management Spear Program. Email Quirine Ketterings. The Adaptive Management Guidelines are online.
Read the other two parts in this article series:
Better than average: Helpful tips for using the nutrient mass balance from a long-term user
Want to be better than average? Use dairy farm nutrient mass balances to improve performance
This article appeared in PRO-DAIRY’s The Manager in March 2019. To learn more about Cornell CALS PRO-DAIRY program, visit PRO-DAIRY Cornell CALS.