


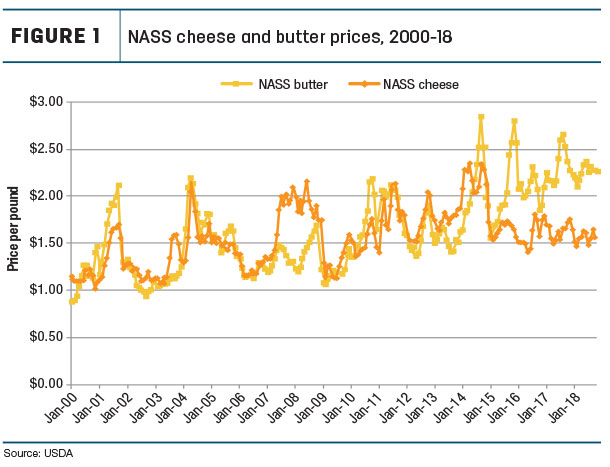
Price changes have occurred over the last five years, with a big impact on producer milk checks. The price of butter has increased while the price of cheese has fallen, creating a price spread between butter and cheese unlike any seen before (Figure 1). That spread is continuing to increase.
The prices of butter and cheese are the basis for calculating Federal Milk Marketing Order (FMMO) producer prices for butterfat and milk protein. With the price changes in butter and cheese in the last five years, butterfat is worth more than milk protein.
When the butter price goes up, the butterfat price goes up. However, as long as the cheese price does not increase when the butter price goes up, the milk protein price goes down. So the price of milk protein has been hit with a double whammy – a lower price for cheese has decreased the price of milk protein, and a higher price for butter has also decreased the value of milk protein in price calculations.
Figure 2 shows the impact of the changing butter and cheese prices on butterfat and milk protein prices.
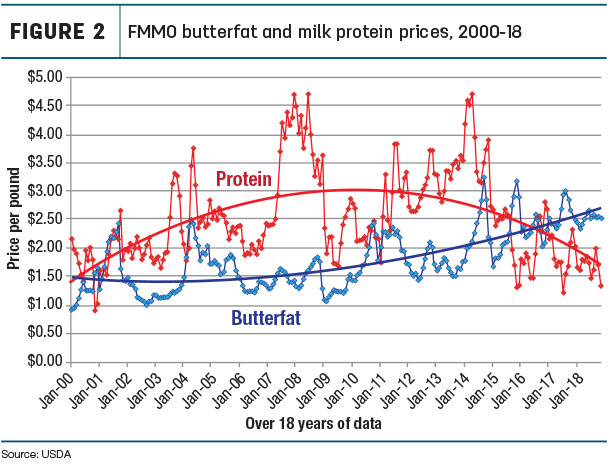
And it shows the spread between butterfat and milk protein prices is growing much faster than the spread between butter and cheese prices.
With these price changes outlined above, producer milk prices have fallen to unsustainable levels. With a higher price for butterfat than milk protein, producers and their nutritionists have reformulated their diets to financially manage revenue. The typical changes being implemented are to reduce feed cost while also emphasizing diets that support increased butterfat.
Before launching into what it will take for the Class III milk price to increase, the formulas behind milk and component prices must be reviewed. If one reduces the Class III formula to its simplest form (numbers are rounded), the Class III formula would look like this.
Class III milk price = (9.6 x cheese price) + (0.4 x butter price) + (5.9 x dry whey price) - $3.20
From this formula, it is easy to see why the Class III price is primarily influenced by the cheese price, with a very small contribution from the butter price. The cheese price per pound is multiplied by 9.6; the butter price is multiplied by only 0.4.
Figure 3 confirms this. The correlation between the cheese price and the Class III price is 96 percent.
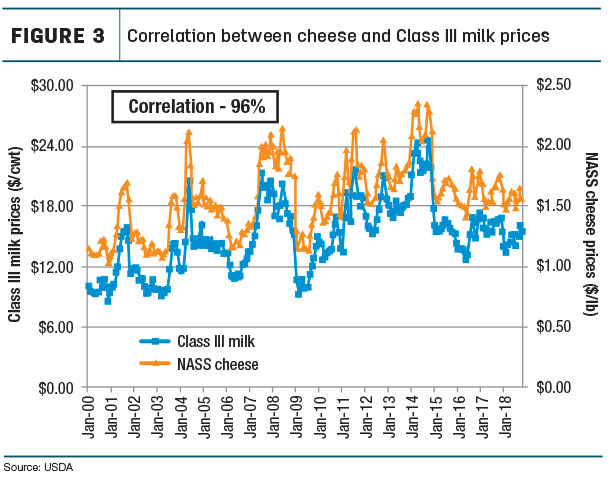
That means the Class III price can be determined with 96 percent accuracy from the cheese price. The price of butter and dry whey have very little impact on the standardized Class III price.
The published Class III price is “standardized,” meaning the published numbers are based on formulas with fixed levels of components. Specifically, using rounded numbers, the formulas are based on 3.5 percent butterfat, 3 percent milk protein and 5.7 percent other solids. (Numbers are rounded for readability.) The published Class III price is really a pricing index not influenced by changes in component levels.
As of October 2018, the butter price was $2.27 per pound, the price of cheese was $1.57 per pound, and the Class III milk price was $15.53 per cwt. If nothing changed except the cheese price, the Class III price will be above $20 per cwt when the cheese price is above $2.05 per pound.
Figure 4 shows the history of the cheese price reported by the USDA’s National Ag Statistics Service.
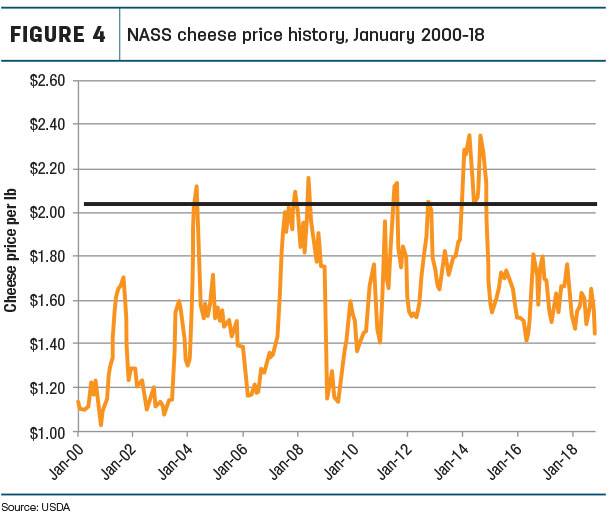
Since January 2000, it has been well above $2.05 per pound numerous times, and that is when the Class III price has also been very healthy.
The only way for Class III milk price to move higher is for the cheese prices to increase, and that can happen only if cheese inventories are reduced.
The formulas for butterfat and milk protein pricing, if also reduced to its simplest form and rounded for simplicity, look like this:
Butterfat price per pound = 1.2 x butter price − 21 cents
Protein price per pound = 3.2 x cheese price - 1.85 x butter price - 43 cents
The real key for a producer to increase his or her personal Class III milk price is to increase herd component levels. Figure 5 shows where the percentages of components have ranged over the last 19 years for the Upper Midwest FMMO, the largest federal order during this period.
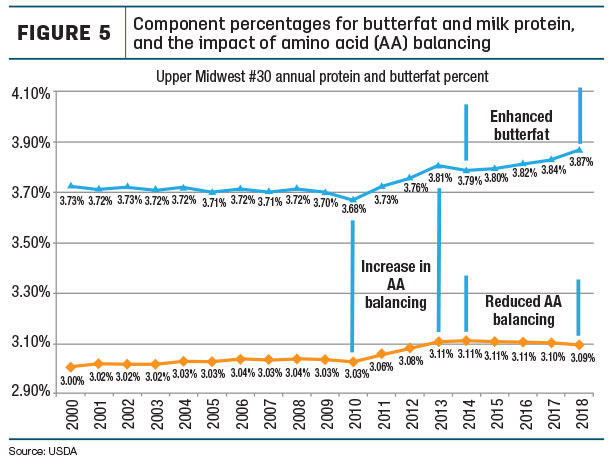
During the period from 2010 to 2014, both butterfat and milk protein increased substantially. The increases in butterfat and milk protein were primarily accomplished by the adoption of amino acid balancing in herd diets. When the price of butterfat went up and the price of milk protein went down, diets were changed to reduce cost and emphasize butterfat production.
It makes sense to improve butterfat production, but it does not make sense to de-emphasize milk protein production. Amino acid balancing did increase the amount of butterfat and milk protein in near-equal amounts.
Since 2014, butterfat production has continued to increase, but milk protein production has fallen. Typically, diets were changed to include items like rumen-protected fats, methionine hydroxy analogue and potassium carbonate. These diets were cost-effective to increase production of butterfat but have no impact on milk protein production. The growing trend to balance diets for amino acids plateaued starting in 2014.
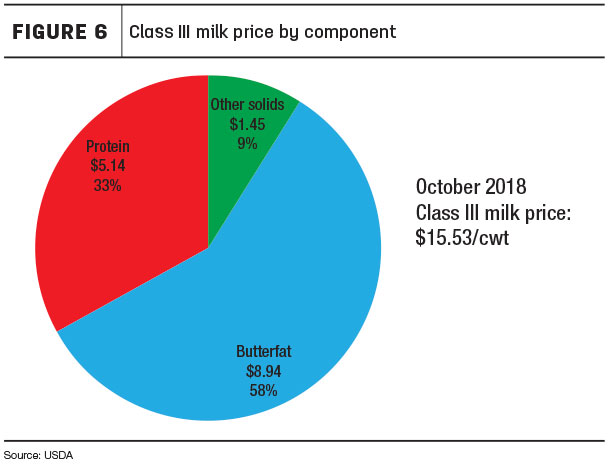
Figure 6 shows the October makeup of the milk payment by component. While butterfat is currently the largest income slice of the pie, milk protein is still an important part of milk payment.
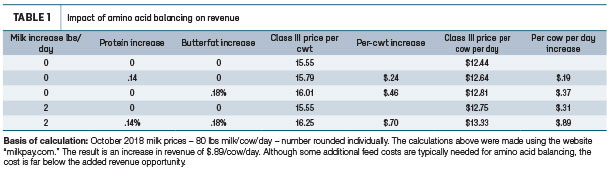
How could revenue and cash flow be improved? Table 1 shows the impact of amino acid balancing at October 2018 producer milk prices.
Click here or on the image above to view it at full size in a new window.
In that month, protein was worth $1.34 per pound, butterfat was worth $2.54 per pound, and the Class III standardized price was $15.53 per cwt. The increased amount of milk protein, butterfat and milk volume increases in Table 1 were based on the results of numerous trials covering thousands of cows where the impact of amino acid balancing was accurately tracked.
Amino acid balancing is typically associated with protein development because amino acids are the building blocks of protein. However, numerous trials show impact is much broader, including more milkfat, more milk volume and overall health improvements.
Table 1 shows an average increase in revenue of 89 cents per cow per day at October 2018 milk protein and butterfat prices. In this example, the initial revenue per hundredweight was based on 3.5 percent butterfat and 3 percent milk protein. With the impact of feeding an amino acid-balanced diet, the effective Class III price rose from $15.55 per cwt to $16.25 per cwt.
Another advantage is: The amino acid balancing will provide incremental revenue and cash flow as component prices improve over time. As mentioned above, changes in the price of butter primarily change the revenue source between butterfat and milk protein, but it has little impact on the Class III price. Having both bases – butterfat and milk protein – covered will help keep consistency in operations and maximize revenue and cash flow.
The only way for a producer to increase revenue and cash flow is to increase the amount of butterfat and milk protein from their cows. Increasing only the amount of butterfat does not increase revenue and cash flow. ![]()

-
John Geuss
- John Geuss Consulting
- Email John Geuss

