
In this article, we will more closely examine the HMS and how herd managers can maximize use of it to ultimately increase their dairies’ profitability.

Background
The HMS was originally introduced in 1994 as a tool for producers to monitor their overall performance and identify opportunities for improvement. It allows herds to track their progress from year to year as well as rank and benchmark their performance.
Keeping score also allows the opportunity to promote excellence in herd management in a friendly competition setting that ranges from local, provincial and national awards presentations. It recognizes outstanding performers and provides a platform where those herds can be profiled and share their approach to achieving superior performance.
Three years ago, the HMS went national and now ranks herds from coast to coast in the CanWest DHI and Valacta service areas, totaling over 7,500 herds for the year 2017.
Over the years, the score has been revised based on producer feedback and updated to reflect the evolution in herd management practices. The scoring system divides a total of 1,000 points across six management areas. Herds are awarded points in each area, and top points are awarded to the very best performance.
A tool to drive improvements
As with all businesses, it’s incredibly important to continually monitor performance and be aware of what top performers are achieving. The HMS is not necessarily a report card on your herd but, rather, a report card on you, the herd manager.
Through your herd’s evaluation, you can determine what areas are doing well and, more importantly, what are the opportunities for improvement. Not only is it important to highlight bottlenecks and areas for improvement, but this is a great chance to celebrate your successes. This is also a great time to schedule a meeting with your advisory team so they can provide input as you set goals and determine an action plan for the next year.
To demonstrate how this works, we will look at the sample herd in Figure 1 for an example.
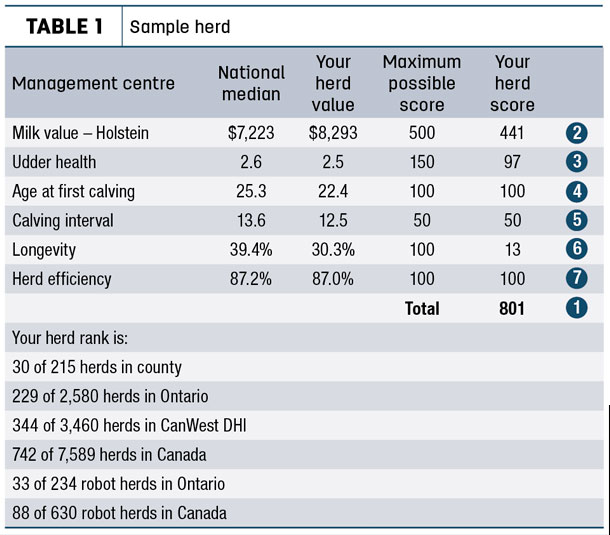
1. Herd rank and total score
From what we can see here, this herd is doing quite well, and managers should be proud of their performance for 2017. They score in the top 10 percent of herds in Canada and are amongst the top 15 percent in robotic herds in Ontario and Canada.
2. Milk value
Again, the herd is doing well and is above the national median. However, there is still some room for improvement to be amongst the top performers. Milk value translates your herd’s average production (milk and components) into an actual dollar figure based on current milk prices. This number gives you a great visual of the revenue impact of efficient production of milk and components. A high milk value is a key driver of efficiency and, ultimately, profitability.
3. Udder health
While still doing better than the national median at linear score 2.5, udder health is a key opportunity for improvement for this herd, as it earned 97 out of a possible 150 points. This herd is still well under any somatic cell count penalty limit, but it should be considered milk loss starts when cows exceed linear score 2 (200,000 somatic cell count).
On average, first-lactation cows lose an estimated 90 kilograms of milk in 305 days with somatic cell count over 100,000, while second-lactation-or- greater cows are estimated to lose double this amount per 305 days with somatic cell count over 100,000.
Clearly, there is money on the table here, and questions should be asked to determine the bottleneck. Are udder health issues a whole-herd situation, a chronic issue, a first-lactation or mature cow issue, a dry pen issue or even a milking equipment or protocol issue?
4. Age at first calving
Age at first calving is an overall measure of heifer management in the herd, including growth and reproduction. Our sample herd has reached the maximum possible score, as they are well below the national median with an average age of 22.4 months.
Research clearly shows having a lower age of first calving does not negatively impact your production. A target of 22 to 24 months is good to strive for, which will lower your heifer-rearing costs and allow them to start making a return on investment sooner. For more details on your own heifer management, refer to the reproduction summary in your annual reports package.
5. Calving interval
Calving interval is a measure of overall herd reproduction. It is easy to calculate and readily available for all herds on DHI service. Our sample herd has a short calving interval and scores very well. No doubt, a better measure of reproductive success is pregnancy risk (which, unfortunately, is not readily available for all herds). Refer to the reproduction summary in your annual reports package for performance analysis in this area.
6. Longevity
Another clear area for improvement within this herd appears to be longevity. Longevity scoring is based on the average annual percentage of cows in the herd in their third or greater lactation. It is an important measure, as it demonstrates a comfortable, healthy and “problem-free” herd.
Cows typically do not start to make a return on investment until second lactation, after they have paid back heifer-rearing costs. Also, mature cows will have higher production when compared to first- or second-lactation animals.
This herd has a value of 30.3 percent, which is quite lower than the national median at 39.4 percent. As a rule of thumb, herds should strive for 50 percent in lactation three or greater.
This herd would benefit from digging deeper into this and asking: Why are cows leaving the farm earlier than expected? What is prohibiting the cows from reaching their maximum potential?
A valuable next step would be to examine the annual management report and look at the removal summary.
7. Herd efficiency
This sample herd has scored well for herd efficiency. This is the average annual percentage of cows in the herd on test day that are milking (not dry). It is a measure of the balance between the lactating period and an adequate dry period. Optimal herd efficiency ensures cows are provided with a balanced lactation and, therefore, no extreme (high or low) is desired.
Herd efficiency is about finding the right balance for your herd. For many herds, the average days dry target is 60 but, in reality, it is often well above that, with several cows having extended dry periods. Look to your annual herd management report, as it provides details on average lactation length and days dry.
Set goals and take action
Your HMS provides a great starting point for overall herd analysis. Use it to ask questions and dig further into the numbers. Determine what your one or two biggest priorities should be and start there.
Include your advisory team to provide a second set of eyes to look for opportunities. Set goals and an action plan and continue to monitor your progress and discuss with your advisers throughout the year to make sure you are staying on course. Finally, watch for next year’s report card, as it will hopefully reflect the improvements towards your goals. ![]()

-
Natalie Walt
- Marketing Specialist
- CanWest DHI
- Email Natalie Walt


