
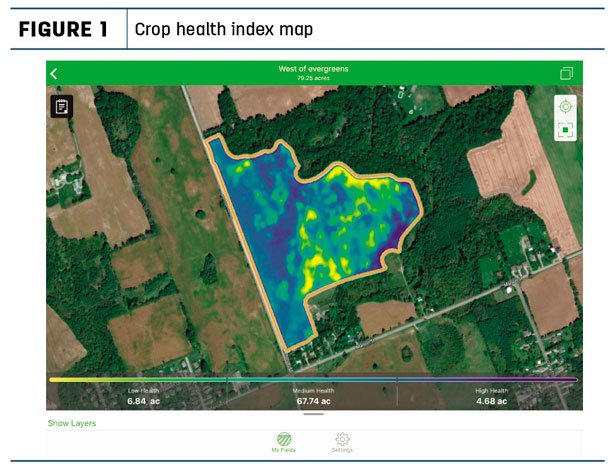
This past season, with the help of tools like Encirca Services Satellite Imagery tool, we could make timely decisions on our fields by looking at a simple crop health index image. Crop health information is taken from a Normalized Differentiated Vegetative index value between zero and 1.
The “zero” meaning the plant has little vegetative or low health, and “1” meaning a high vegetative or high health of the plant. In the images, the more “blue” the area is correlated to the higher health, and the “light green” and “yellow” areas are low or lower crop health. Images can be created on your field by generating a spatial boundary around the field, adding a crop type (soybeans, corn, wheat, alfalfa, etc.) and a planting date.
In a challenging season, such as 2017, we saw value in tools like these when it came to evaluating variable rate seeding and fertility programs, assessing soil health issues, scouting hybrid placement and validating alfalfa mixtures.
Variable rate seeding and fertility
Historically, the field in Figure 1 has been variable when it comes to yield. If we look at the previous year’s yield map, it will show the areas in the central-east side of the field generally yield lower than the west side.
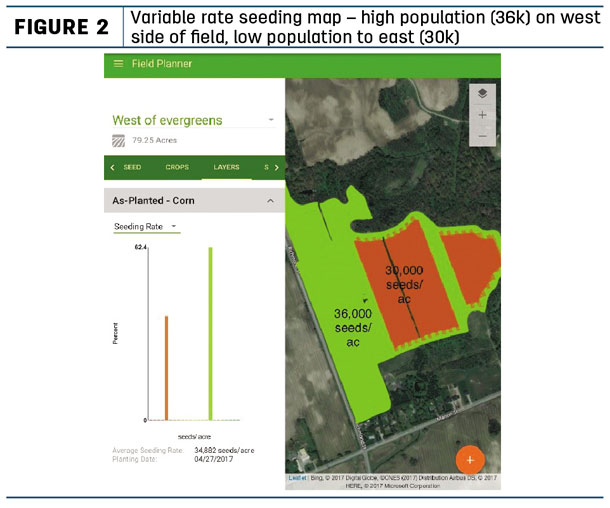
As a result, variable-rate seeding was used to minimize risk and maximize yield potential. The low area seeding population was dropped to 30,000 seeds per acre, and the high crop health area seeding rate was increased to 36,000 seeds per acre. A check strip was placed in the east (Figure 2).
Hybrid scouting and differences
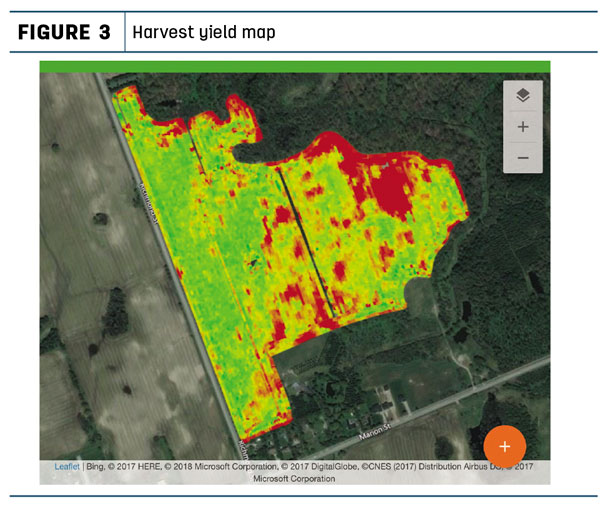
When comparing the 2017 harvest yield map (Figure 3) to the crop health index, it shows crop health index correlates to yield.
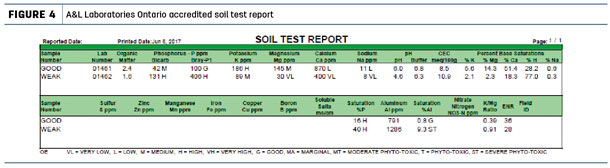
One question to ask when looking at this data is: Did we look at all the variables? That is when turning to a soil sample or tissue sample is necessary. In this case, a soil sample was taken from a high crop health area (Sample number: good) and a low crop health area (Sample number: weak) in Figure 4.
Click here or on the image above to view it at full size in a new window.
There are a few fertility problems we can pick out in this field. The value that sticks out in the weak sample is the very low pH, 4.6. The next area to look at is magnesium; it has a very low value of 30 parts per million. Grass tetany, a metabolic disease that affects cattle and sheep livestock, is caused by a magnesium deficiency.
Fast-growing spring grass can often be devoid of the amount of magnesium livestock need to survive, making dolomite lime an important consideration if you are using your fields for livestock grazing.
Dolomitic lime was applied to this field in the fall. This field will be monitored for any crop health changes in the 2018 growing season to determine if pH was the limiting factor.
In Figure 5, there is a progression of corn growth from June to August. The three images are consistent over time with the health zones it created.
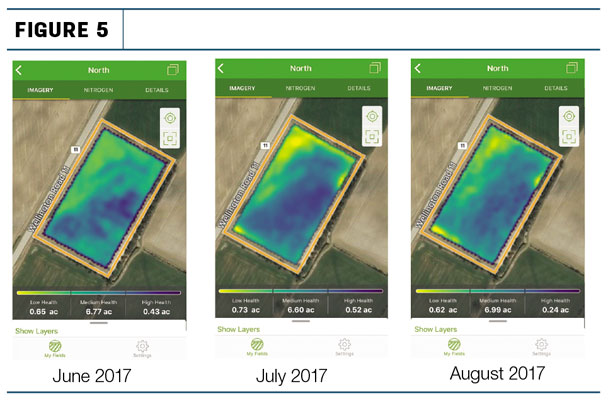
In the southeast half of the field, there is a more consistent corn crop and, in the northwest corner, it is more variable, resulting in a lower health index. There are eight different hybrids planted in this field. In order to see whether there was a significant difference in silage quality between the “healthy” areas and “unhealthy” areas, samples were taken from high-health areas and low-health areas.
John Deere’s Harvest Lab was used to assess moisture, starch and neutral detergent fiber on each sample. Samples were taken on Sept. 21. From the low-health areas, the sample had a higher average moisture sitting at 76.5 percent; starch and neutral detergent fiber were 36.7 percent and 43.3 percent, respectively.
In the high-health areas, sample moisture was 71 percent with starch and neutral detergent fiber at 33.1 percent and 44.1 percent.
The crop health tool can also be used to scout hybrids throughout the year. Figure 6 is a screen shot of the as-planted map from spring.
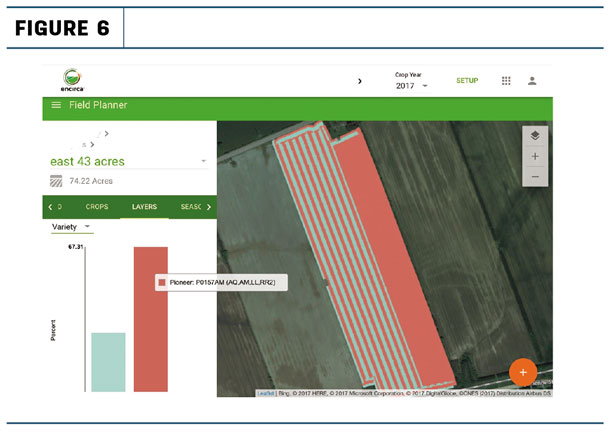
Figure 7 is two satellite images of the field, one taken July 31 and the other on Sept. 17. A helpful part of the tool is turning on the location services in the app to follow where you are scouting in the field.
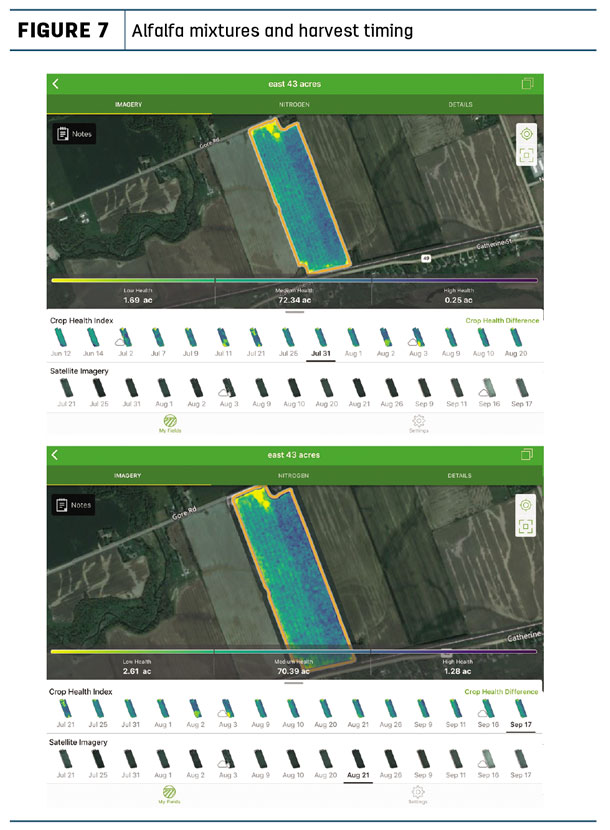
In a year with lots of western bean cutworm pressure, timely and efficient scouting was needed to determine whether to spray, as well as spray timing. Using a crop health index can help you determine the areas where there may be some high insect feeding areas, disease pressure, or the hybrid placement choice could be improved for next year.
Alfalfa mixtures and harvest timing
In Figure 8, the four pictures represent a field of first-year seeded alfalfa. The crop health index was used as a tool to help determine harvest timing and areas to harvest.
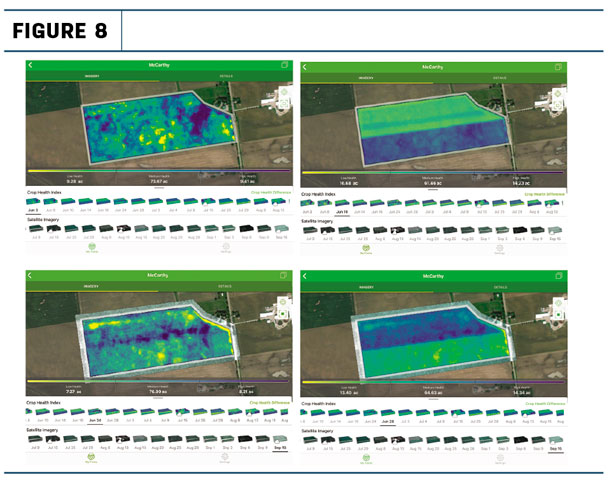
On June 3, the field shows the growth to be quite variable so, on June 10, just half of the field is cut in the north side. The regrowth is shown in June 24, with the south half of the field being harvested June 28.
This is an instance where we can start to tie in other factors that may be affecting regrowth, which could lead to why the field is variable. Precipitation is a good example of how this field may be reacting. We could make the assumption one side of the field received more rain than the other, depending on the rain events.
The last example (Figure 9) shows a field with an alfalfa-grass mixture for feed. The east side of the field is in the low crop health range, while the west side is in the high crop health range.
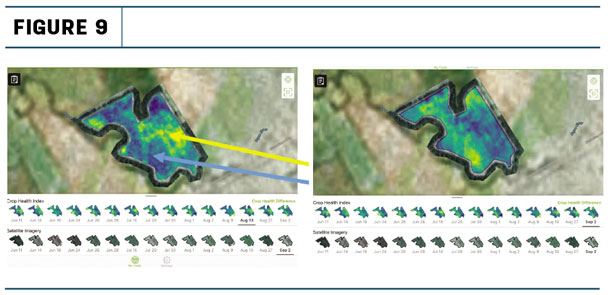
The field was cut after Aug. 13. When looking at the crop health image for Sept. 2, the crop health status for the field has switched, where the east side is now the high crop health and the west side is the low crop health.
When the field was walked, the observation was: The area of high crop health post-harvest was mostly the grass mixture, which was fast to regrow. The low crop health area post-harvest was the alfalfa, which was slower to re-grow. The management decisions to take from this would be to determine the percentage of the field that is alfalfa versus grass and decide whether the field needs to be rotated out for next year.
Tools like satellite imagery can provide many observational insights to your fields. These tools are easy to use. It can provide a crop health picture of your fields every three to five days and offer location services for scouting purposes. Although walking your fields is a standard scouting protocol, you can start to narrow down your walking distance to the problem areas of your fields.
The progression of health in the field is viewed throughout the growing season, and the decisions made will save time, which is one of the aspects of farming we wish we had more of. If you would like to try tools such as the crop health index, talk to your close farm advisers, as there are many tools such as this in the market to help make better decisions during the growing season. ![]()
Kaye McLagan is a encirca services consultant SW Ontario with DuPont Pioneer


