


In both the stocker and backgrounding segments of the cattle industry, there are margin decisions to be made. This means cattle will be purchased at one price, be fed or grazed to a higher weight and then sold at another price and point in time. The difference between the beginning and ending price and weight comprises the margin or value of gain.

For example, if you purchase 650-weight cattle today at $165 per hundredweight and plan to sell them in 90 days at 800 pounds, a sales price of $150 would make your margin:
(800 X 1.65) – (650 X 1.50) = $127.50 per head or $85 per hundredweight value of gain
Stocker operations here in the Flint Hills of Kansas often prefer an early intensive double-stocking scenario, so I will use this as an example to show a historical perspective of their margin, but the same exercise can be done for any buy and/or sell decision in the cattle industry.
Figure 1 shows the nominal sales price of an 800-pound steer in July as a percentage of the purchase price of a 650-pound steer in April (all per hundredweight). You can see, on average, the price slide is 92.8 percent.
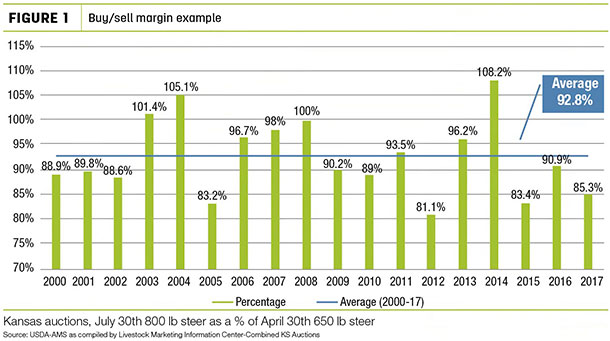
Some years are more favorable than others, even increasing in sales price versus purchase price, but over the long-term, stocker operators need to survive in a market where their sales price per hundredweight is 92 to 93 percent less than their purchase price. Obviously, weight gain is another risk along with price fluctuations, but hopefully, by knowing the kind of cattle you are purchasing, this can be somewhat mediated.
Table 1 shows summary prices for the same margin presented in Figure 1.
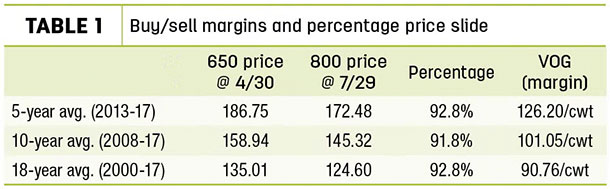
As you can see, prices per hundredweight have increased over time, but in every time horizon, the average price slide is still near 92 percent. Using the near-term (five-year) average value of gain (margin), the cost structure of the cattle operation can be analyzed to see what profitability exists in an “average” year and that information can be used to make future sales and purchasing decisions. This can only be answered by knowing and managing your cost of production.
Table 2 shows an example budget of the same early intensive double-stocking scenario of purchasing cattle at the end of April and selling them at the end of July.
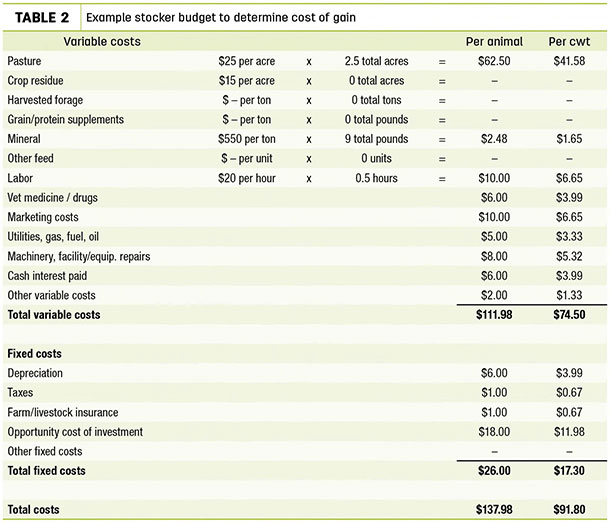
As economists, we attempt to capture the “true” cost of production. Many of you would probably say, “but I could send them to the feedyard for cheaper than that.” That may be true; however, you will still have hauling, marketing, management time, cash interest costs and all of the fixed costs still wrapped up in your cattle purchase.
Oftentimes, what we think of as our cost of production is the cash costs it takes to achieve gain on cattle, which equates to total variable costs (in this example, $74.50 per hundredweight). The true costs of gain, however, also takes into account depreciation, or loss in value of machinery and equipment used in the cattle operation; sunk costs of taxes and insurance on property; and opportunity cost.
Opportunity cost simply assigns a value to what return could have been made if the capital used to invest in and grow cattle was made elsewhere; something not often considered on the budget.
The rule of thumb in economics is that gross income needs to be sufficient to cover variable costs, or it would be better to not even purchase. In the long run, total costs need to be covered for the business to be profitable.
Comparing the example cost structure in Table 2 to prices in Table 1, you can see in the five-year horizon, profits over total costs were realized for this operation. Looking at Figure 1, however, 2013 and 2016 were the only years close to average. Large profits in 2014 created by an advantageous price movement were offset by losses in 2015 and 2017.
In summary, a stocker operation in the Flint Hills of Kansas with this cost structure would be profitable and sustainable as long as they can withstand the year-to-year fluctuations in return. How is this useful going forward? A tool on Beef Basis can be used to project sales prices and in turn, provide information to the cattle operation if profit potential exists to where purchasing cattle is advantageous.
Going into 2018, a projection pulled on Feb. 12, 2018, shows expected sales price at the Salina, Kansas, Farmers and Ranchers Livestock Commission of $151 per hundredweight on July 31, 2018, for 800-pound steers. Given the information discussed earlier, Table 3 is the profit potential for this Flint Hills ranch.
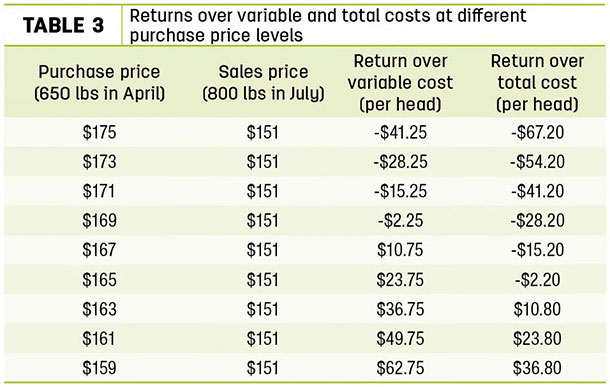
This cattle operation would need to purchase at $164.66 per hundredweight or less to cover total costs and $168.65 per hundredweight or less to cover variable costs. Knowing this breakeven will help in identifying profit potential when purchasing.
Risk management is not discussed much here but also needs to be considered. Death loss can either be added to variable costs per head or by a reduction in expected sales price. Hedging cattle will add costs, but will reduce risk around the sales price. Leaving a buffer or a certain level of projected profit that you not accept less than before making a purchase is also another strategy, but leaves the door open for significant losses if price moves severely in an adverse direction.
Anyone in the cattle business knows it’s a risky one. Tracking profitability, costs of production and using this information to make informed decisions will certainly help the operation stay in business during these tough economic times. ![]()

-
Robin Reid
- Extension Economist
- Kansas State University
- Email Robin Reid


