The report estimated the U.S. cattle herd at 103 million head, up slightly from a year ago.
Estimates in all categories were at or above last year except for beef cow and calf crop estimates, which were decreased for calves under 500 pounds at midyear. Although this marks consecutive growth at mid-year since 2014, this year’s increase reflects the impact of Covid-19 on meat-packing facilities’ ability to maintain slaughter levels in second-quarter 2020.
Reduced slaughter levels slowed the pace of marketings, leading to the same number of cattle remaining in feedlots of all sizes as in the prior year, 13.6 million head. This also had the effect of increasing the number of cattle outside feedlots. The ERS webpage “Livestock & Meat Domestic Data” includes a table titled “Feeder Cattle Supplies Outside Feedlots,” which estimates the number of cattle available for placement in feedlots at 37.4 million head, larger by 300,000 head, or 0.8%, than at this time last year.
Although the number of beef cows was 250,000 head and 0.8% lower than a year ago at 32.1 million head, the number of dairy cows is estimated at 50,000 head and 0.5% above a year ago, at 9.4 million head. The calf crop is estimated to be only fractionally below a year ago, at 35.8 million head.
Based on the number of beef cows on July 1, ERS estimates that 7.6% more beef heifers entered the herd in first-half 2020 than over the same period last year. A table on the ERS webpage “Livestock & Meat Domestic Data” titled “Heifers Entering the Herd” estimates that 2.7 million heifers were added from January to June this year for beef cow replacement. According to the Cattle report, producers intend to keep about 4.4 million beef heifers as replacements, the same number as last year. Producers’ intentions signal a refreshment of the beef cow herd, as this is the second year in a row for lower beef cow inventory without a reduction in replacements.
According to the July NASS Cattle on Feed report, cattle in feedlots with a capacity of 1,000 head or more totaled 11.4 million head on July 1, 2020, down less than 0.5% from 2019. This was the second-largest number of cattle on feed for the month since the series began in 1996. The NASS report also estimated the classes of cattle on feed as 7 million steers and 4.4 million heifers. Compared to 2019, the number of heifers on feed decreased by 1.5%, while steers increased fractionally. Heifers represented 39% of cattle on feed on July 1, even with last year.
Beef production forecast raised on pace of fed cattle slaughter
The 2020 beef production forecast was raised by 94 million pounds from the previous month to 27 billion pounds, based primarily on a quicker-than-expected pace of fed cattle slaughter in June and July (Figure 1).
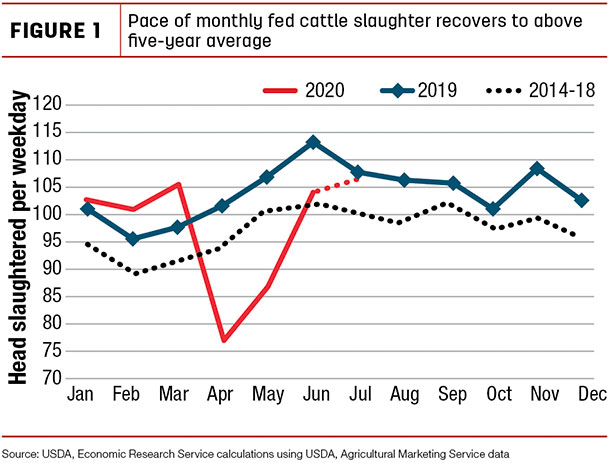
Based on the NASS Livestock Slaughter report for June, the pace of fed cattle slaughter was estimated to be about 92% of last year. Based on USDA Agricultural Marketing Service data for actual and estimated slaughter of steers and heifers in July, the pace of fed cattle slaughtered was almost 99% of the pace of slaughter in July 2019. Although daily slaughter rates are inconsistent, weekly slaughter is bolstered with slaughter levels on Saturday. To estimate the pace of slaughter, the number of animals slaughtered is divided by the number of weekdays in a month, which can vary year to year.
Although, the number of cattle outside feedlots did increase over last year, it was less than expected. The tighter feeder cattle supplies will likely slow expected placements in first-half 2021. This reduced the estimate for late-2021 fed cattle slaughter and, as a result, the forecast for 2021 beef production was lowered by 100 million pounds from the previous month’s forecast to 27.6 billion pounds.
Fed cattle prices raised in second-half 2020 and early 2021
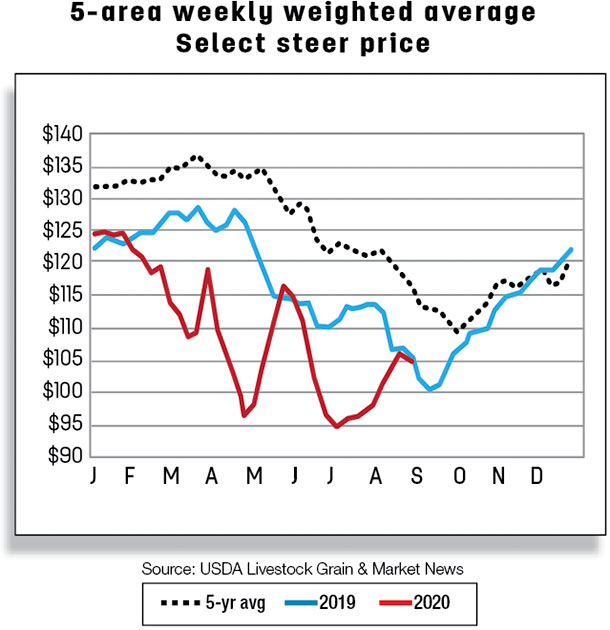
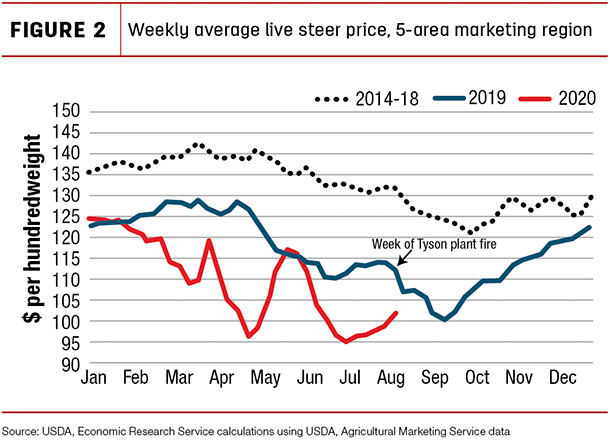
The week ending Aug. 7, 2020, marked the fifth week of higher week-over-week prices in the 5-area marketing region with $2.68 over the previous week at $101.34 per hundredweight (cwt). However, this is still about 10% below the same week last year. That week in 2019 was the one in which the fire occurred at the Tyson plant in Finney County, Kansas, closing the facility for several months. Following the fire, prices declined for five weeks and did not eclipse pre-fire price levels until seven weeks after bottoming.
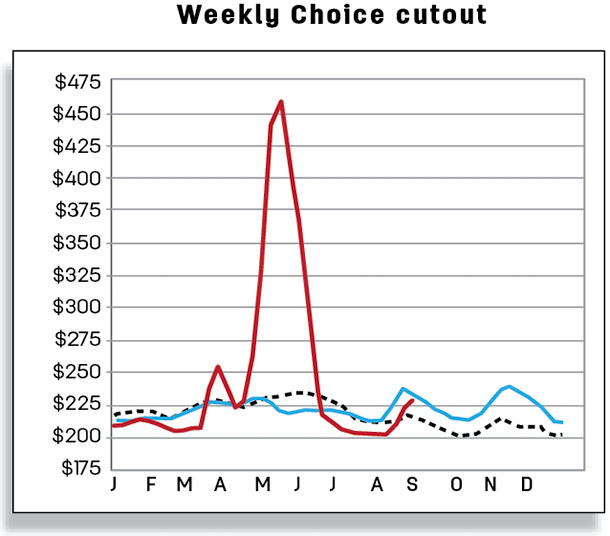
Typically, as in Figure 2, fed cattle prices decline seasonally to a bottom level in late third quarter or early fourth quarter.
As prices appear to have reached a seasonal bottom in the third quarter, price strength may be further affected by economic uncertainty weighing on beef demand in the fourth quarter, at a time when average carcass weights are more than 3% above last year and rising seasonally.
The price forecast for third-quarter 2020 was raised $1 to $101 per cwt, and the forecast for fourth-quarter 2020 was increased by $1 to $105 per cwt. As a result, the average 2020 annual price is forecast at $107.30 per cwt, about 50 cents higher than the previous month.
The estimated price strength was carried forward to the first quarter of 2021, with the price raised $1 to $105 per cwt for an annual fed steer price of $110 per cwt.
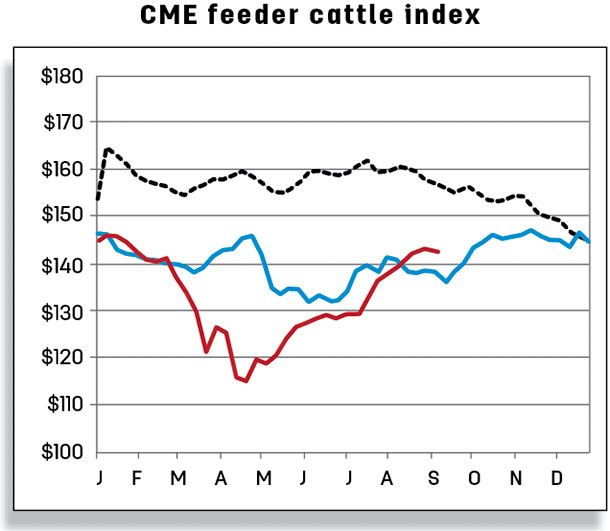
The price for feeder steers weighing 750 to 800 pounds for the week of Aug. 10, 2020, was $142.93 per cwt, more than $5 above the same week last year. Based on improved feeding margins, a smaller estimated calf crop in 2020 than a year ago and fewer cattle outside feedlots than expected, the third-quarter 2020 feeder steer price was raised by $7 to $140 per cwt, and the fourth-quarter 2020 forecast was increased $9 from the previous month to $140 per cwt. This month’s annual price forecast for 2020 is $135.70 per cwt.
This year’s calf crop is estimated slightly smaller than in 2019, which will likely reduce cattle available for placement next year. With these expected tighter supplies and cheaper feed costs supporting demand, the price strength was carried over into 2021, and as a result the annual price forecast for feeder steers was raised $3 to $137 per cwt.
Beef imports higher in June
U.S. beef imports in June rose to 309 million pounds, an increase of more than 15% from a year ago (Table 1).
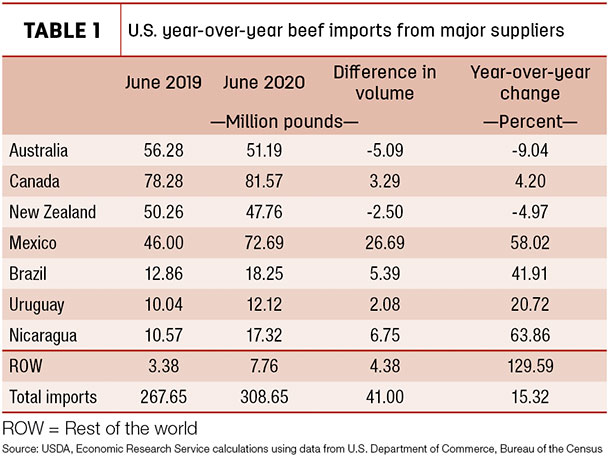
June’s expansion was fueled partly by the strong demand for processing-grade beef. Imports from Canada were particularly high in June (81.57 million pounds), a level not achieved since June 2010 when beef imports from Canada reached 83.89 million pounds. While U.S. beef imports from Canada were up 4% in June, it was also the second consecutive month in which Mexico shipped over 72 million pounds to the U.S.
The strong U.S. demand for Mexican beef was partly driven by a favorable exchange rate and depressed Mexican demand for Mexican domestic beef. Shipments from Oceania, particularly Australia and New Zealand, were down 9% and 5% year over year. In June, Oceania, Canada and Mexico accounted for 82% of the total U.S. beef imports. A large portion of the remaining beef imports came from Brazil and Uruguay, whose beef shipments to the U.S. exceeded levels of a year earlier. Finally, Nicaragua’s beef shipments to the U.S. were 6.75 million pounds, 64% higher than a year ago.
The second-quarter beef imports totaled 848 million pounds, the fifth-highest volume recorded in the second quarter since 1989. The forecasts for 2020 third- and fourth-quarter imports were revised up to 810 million pounds (+50 million) and 705 million pounds (+20 million), respectively, as domestic demand for processing-grade beef is expected to remain robust. U.S. beef imports in 2020 are further supported by a shift in product from Oceania’s beef exports from China toward the U.S.
In June, Australia and New Zealand exports to China were 23% and 48% lower year over year, respectively. The forecasts for 2021 first and third quarters were raised to 755 (+15 million) and 765 million pounds (+10 million) on stronger expected demand for processing-grade beef. The annual forecasts for 2020 and 2021 are 3.124 and 3.045 billion pounds, respectively.
U.S. beef imports during the first half of 2020 have been stronger than they were over the last two years (see the gray bar in Figure 3).
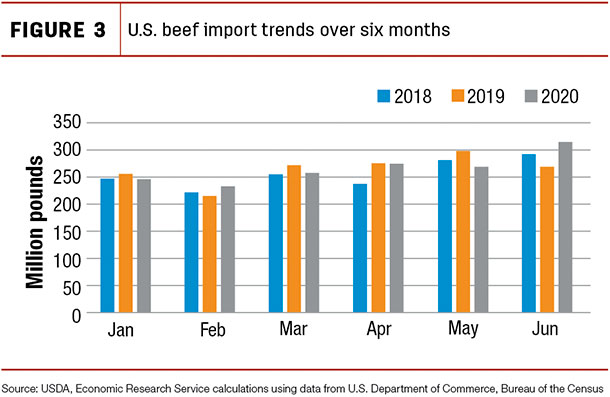
The amount of beef imported over the six months of January through June totaled 1.622 billion pounds, 3% higher than 2019 imports and 6% higher than in 2018. The vast majority of U.S. beef imports (46%) during January-June 2020 came from Canada and Mexico, followed by Australia and New Zealand, whose combined shipments accounted for 37% of U.S. total beef imports during the first half of 2020. Brazil, Uruguay and Argentina contributed smaller amounts to the U.S. beef supply.
Beef exports down in June
U.S. beef exports in June 2020 were 183 million pounds, over 90 million pounds or 33% less than a year earlier (Table 2).
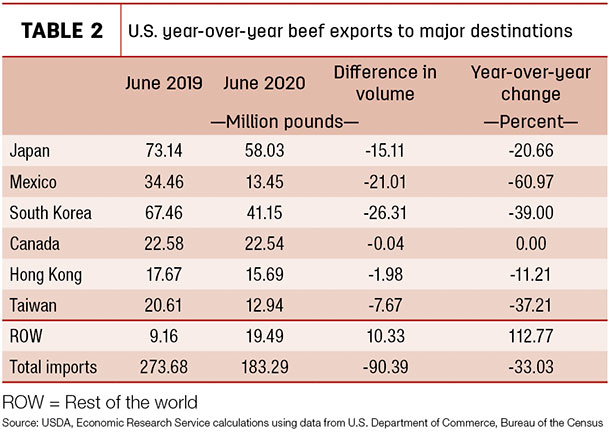
For two consecutive months, U.S. beef exports have been in the range of 183 to 188 million pounds, the smallest (in volume) since May 2009 when U.S. exports were 173 million pounds. The first- and third-largest reductions in exports in June were to South Korea and Japan.
There is often a lag between a sale of beef for export and its shipment; therefore, product shipped in June was likely sold to South Korea and Japan in late April or early May, when exportable beef supplies were low due to COVID-19 outbreaks in U.S. beef processing plants.
These outbreaks caused temporary closure of some beef processing plants, leading to reductions in slaughter capacity and beef production. High beef prices likely led exporters to make fewer sales for June. Beef exports to Mexico had the second-largest reduction year over year, partly reflecting high U.S. beef prices and an economic downturn in Mexico and Mexico’s depreciated currency. Beef exports to Taiwan were down 37%, while to Hong Kong they were 11% lower year over year.
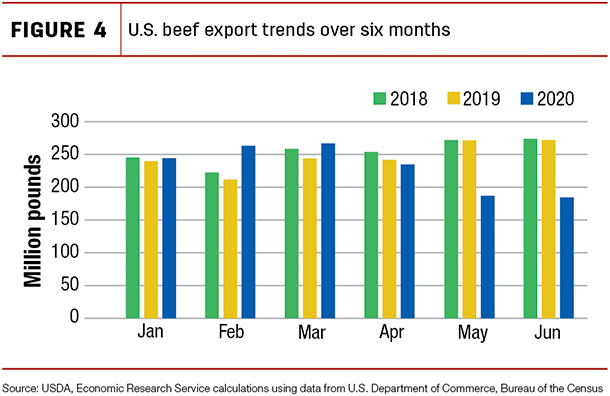
The trend of U.S. beef exports from January through June 2020 has been mixed. U.S. beef exports were strong in the first quarter of 2020, exceeding the volumes shipped during the first quarters of 2019 and 2018. A minor reduction occurred in April exports, but more noteworthy changes occurred in May and June (see the dark blue bar in Figure 4).
COVID-19 disruptions to U.S. beef production set some limitations on export supplies during May and June. Along with the disruptions of the pandemic came declines in beef export supplies throughout the second quarter of 2020. The declines partly reflected a weaker demand in Asia, along with the COVID-19 disruptions in the U.S. during April and May.
Second-quarter 2020 beef exports totaled 608 million pounds. The third- and fourth-quarter beef export forecasts were unchanged from July at 770 and 750 million pounds. As a result, the annual beef export forecast for 2020 was revised to 2.896 billion pounds. The 2021 forecast was unchanged from the previous month. ![]()
Analyst Christopher Davis assisted with this report.
Russell Knight is a Market Analyst with the USDA – ERS. Email Russell Knight.