


Every state in the Northeast experienced one of their top-10 warmest years, except for West Virginia where it was the 11th warmest year on record. Warmer-than-normal temperatures were a common theme in all seasons across the region.
Year-to-year changes in the weather on the farm is nothing new and farmers are known for being in tune with the weather. However, with conditions changing so quickly and increased variations in weather conditions both within a growing season and from one year to the next, having quick and easy access to the most recent weather data and tools (websites) that can assist in applying these weather data to on-farm decisions is becoming more important.
This is why Cornell’s Climate Smart Farming Program (CSF) Decision Tools (Climate Smart Farming) were created. The tools have been developed through a partnership between the CSF program and the Northeast Regional Climate Center (NRCC). The NRCC archives and supplies daily temperature observations from the National Weather Service (NWS) and daily precipitation from NWS radar data. These data are interpolated to a 4-km-by-4-km grid allowing farmers in the region to access accurate information for their farm even without a weather station on their site.
Growing Degree Day (GDD) Calculator
This tool tracks GDD accumulated based on a user-provided starting (planting) date and provides a forecasted accumulation over the next six days (Figure 1).
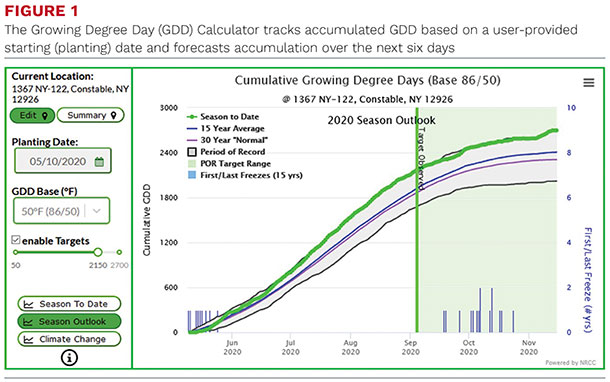
On the left side of the screen, the user can select their exact field location and enter data specific to their farm and crop. Using the gridded weather data associated with the farm, a chart on the right summarizes the average and extreme GDD accumulations for the long-term climate record of the site, plots the current season’s GDD accumulation, and provides supplemental data on the likelihood of below-freezing temperatures at different points during the season. Users have consulted the GDD tool to make decisions about varieties, predict harvest dates and decide on alternative crop feasibility at the start of the growing season.
In the example depicted, 95-day corn (2050 GDD to maturity for silage) was planted on May 25 in 2020. In this warm growing season, the target of 2050 GDD was reached on September 6 as shown by the vertical green line, well before the historical date of the first fall frost which is shown by the blue lines at the bottom of the graph. 2020 was an especially warm year, notice the green curve follows the top portion of the gray area indicating that 2020 was comparable with the highest GDD accumulations observed at this station. The farmer also notices that on average (the blue curve shows the average GDD accumulation) the accumulation of the targeted 2050 GDD, also occurred before the first frost in most years. However, in the colder seasons, when fewer GDD accumulate, there is still the risk of not achieving the required 2050 GDD. This is shown by the shaded green area which runs past all the observed first frost data and through the end of the year.
Nonetheless in an effort to maximize silage yield, the farmer may opt for a 105-day (2150 GDD) variety. This can be simulated by changing the target on the left to 2150 and perhaps selecting an earlier planting date, say May 10. With these changes, the graph refreshes and shows that the longer-season corn would have matured in 2020, but the risk of not achieving enough GDD before the first frost increases in other seasons, which may negate the potential benefits of selecting a longer-season corn variety.
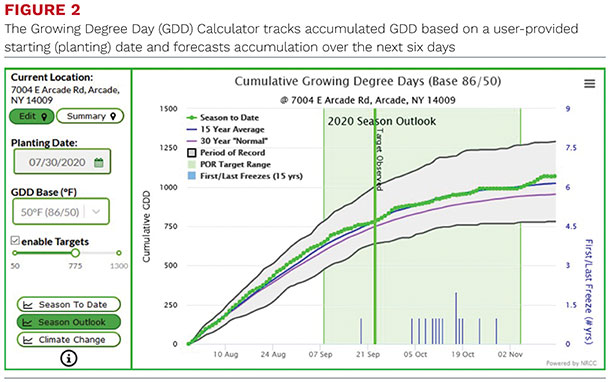
The GDD tool has several other applications. During a cool summer, a grower may wonder if the crop will reach maturity before the first frost. In this case, the silking date can be used in place of the planting date and the target GDD changed to 775 as research for New York determined this is the approximate GDD interval between silking and maturity for silage corn. Figure 2 shows that in this example, enough GDD would accumulate if the remainder of summer was very warm, but even if average temperature conditions occurred, the crop would likely reach maturity, since in only one previous year did frost occur before Sept. 23, the average date of maturity determined by the tool. If the weather continues through the summer, the chances of reaching maturity before the frost decrease considerably.
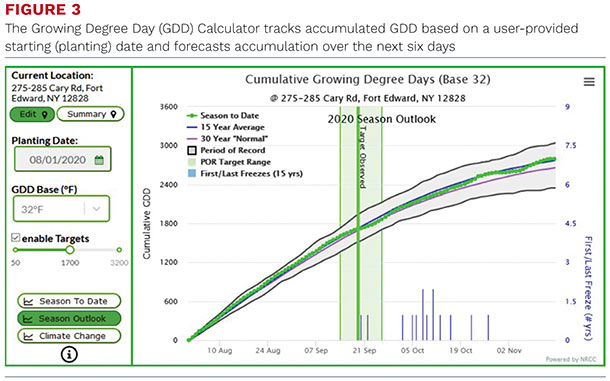
Finally, suppose the planting window was delayed during a cool wet spring. One option might be to consider an alternative crop such as summer-planted forage oats, if the forage oat maturity requires 1,700 base 32°F GDD. In the tool, the GDD base and targets can be set, and the planting date of August 1 entered. Figure 3, shows the decision to plant oats would be feasible, in 13 of the last 15 years.
COVER CROP Scheduler
The Climate Smart Farming website includes a number of other tools that growers may find useful. The cover crop CSF Winter cover crop planting scheduler – calculates how late into the growing season cover crops can be successfully planted to achieve their intended goals. These goals can include reaching critical amounts of biomass, reaching developmental stages that ensure overwintering success, etc. This tool helps to quantify the risk involved to maximize the chances of success. At this time, the cover crop tool uses models that are optimized for rye, buckwheat and mustard production. Like the GDD tool, this site provides a chart showing the chances of reaching important levels of cover crop growth by the end of the growing season. Probability of success decreases as later planting dates are chosen, allowing the user to see the consequences of waiting several days or weeks to plant.
WATER DEFICIT CALCULATOR
The water deficit calculator – CSF Wate deficit calculator – estimates soil water content within a crop’s effective root zone to inform decision makers about current and forecasted water deficits. This information can be used to determine the optimum frequency and duration of watering that is necessary to avoid plant stress.
IN SUMMARY
Weather-related risks are a constant threat to agriculture, especially as the climate changes. Conditions during past growing seasons are quickly becoming a poor guide for what to expect in the current or future years and increases in weather variability complicate management decisions. Incorporating real-time weather data and historical climate information into the decision-making process, offers one way to mitigate these ever-changing weather risks. Climate-smart farming tools make accessing and applying high-quality weather data and agricultural models to on-farm decisions no more than a click away from your computer, tablet, or phone.
| This article appeared in PRO-DAIRY's The Manager in March 2022. To learn more about Cornell CALS PRO-DAIRY, visit PRO-DAIRY. |


