
In the March issue, we talked about the importance of a scoreboard a farmer or rancher could use to measure the financial progress of all the hard work that entails ag production. Since then, a lot of this hard work has taken place.

A prolonged spring with cold weather has made calving a bigger chore than normal, and as of the end of March, few tractors have been in the local fields to work the land, making the spring rush more pressing. I have met with several producers this year, and there is no lack of long days and prep for the coming year.
Time in ag production is spent on the most critical issue each day. Several tasks (planting, harvest and irrigating) will take precedence over the paperwork. Still, two important facts remain: A producer needs to have timely financial information, and a producer needs to understand what the financial information indicates regarding the operation.
As an industry of ag producers, the financial statements are sometimes underutilized, and the understanding of them is not as refined as could be. This is no critique of any individual or any operation. It is more a statement of how demanding the production issues are on any given day in this industry. Calving in the winter is a great example of how the demands preclude the need for timely financial statements and understanding them. These statements still tell an important story.
From the previous article, you may recall we met Mr. Hay Dude. He started his production cycle with a net worth evidenced on his balance sheet of $700,000. His balance sheet would look like Table 1.
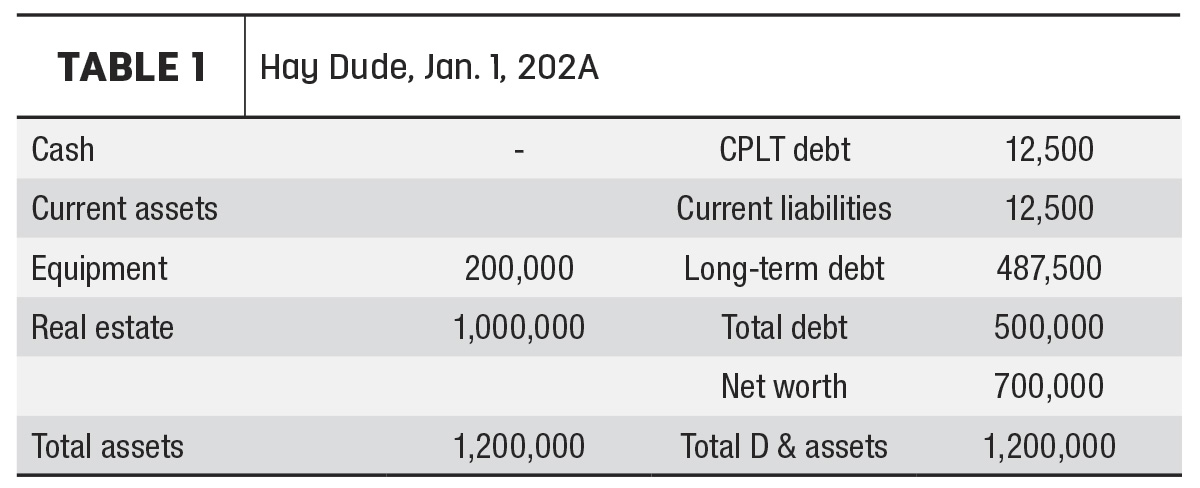
Mr. Dude has a net worth or earned equity of $700,000. The net worth or earned equity is the total of assets less the debt. The assets are real estate and equipment to start the production cycle. The liabilities include the loan of $500,000 owed against the real estate.
With that, the net worth is $1 million + $200,000 - $500,000 = $700,000. To operate, Mr. Dude borrowed $100,000 and produced 1,500 tons of hay. Then one day in September he sold the hay and paid all the bills and accrued interest.
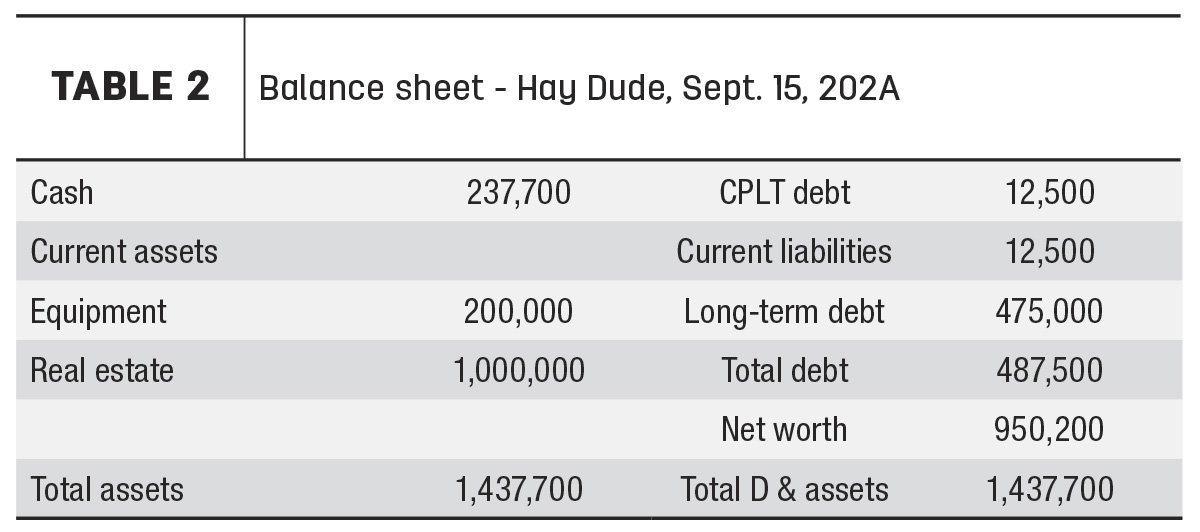
This is how the cash flowed through the entity. First, he had $375,000 in his hand from the sale of the hay. He paid the operating line to zero plus $4,800 in interest. At this point, he had $270,200 cash in hand. Next, he paid his real estate loan payment. That payment was credited as $20,000 of interest expense and $12,500 of principal. Now Mr. Dude has $237,700 in cash in his hand. Assuming the fixed assets of land and equipment didn’t change in value, Mr. Dude’s assets are: total cash $237,700; land $1 million; and equipment of $200,000, for total assets of $1,437,700.
The liability side of the financial statement looks like this: He now has a real estate loan in the amount of $487,500. This is the original liability of $500,000 less the principal payment of $12,500 to reduce this liability to $487,500. The total liabilities of $487,500 subtracted from the total assets of $1,437,700 results in a net worth of $950,200. That balance sheet would look like Table 2.
At this point, compare this net worth or earned equity to the net worth at the start of the production cycle of $700,000. The new earned equity of $950,200 versus the beginning earned equity of $700,000 indicates an increase of $250,200 for the production cycle or a production profit of that amount.
So the earned net worth or the production cycle net income is $250,200. The hay is sold, the bills are paid, and Mr. Dude is better off by $250,200. But cash is increased by only $237,500. Where is the rest of the production cycle net income?
To answer the question of where the production cycle income came from, here is something to note about balance sheets. Earned net worth results in an increase in assets or a decrease in liabilities. The cash increased in our example, but remember the principal of the real estate loan paid down by $12,500 (or the exact amount that cash is less than the production cycle income).
Interestingly, if the balance sheet was constructed the day before the hay sold, the production income would be the exact same plus one day of accrued interest on the operating note and the real estate note. The production gain would mostly be the hay in the stack at that point. While this does not track to generally accepted accounting principles exactly, this comparison of a balance sheet over time will always most closely represent the net production income or loss when compared over a previous period. The crop or livestock raised in a ranch or farm operation doesn’t need to be sold to calculate the production income. That is why the balance sheet is the best measure of production profit or loss at any specific stage of production.
This balance sheet comparison is a measure of accumulated assets and identifies what a producer owns versus creditors, if you will. Each term loan payment applied lessens the amount of assets the creditors own. Look at the real estate loan in our example. The producer at the end of the cycle owns $12,500 more of the real estate than at the beginning of the cycle. Also, the producer added an asset in the cash account. This indicates what all the 14-hour days and working in the cold and heat while producing an agricultural product netted the producer in profits.
This financial tool, the balance sheet, becomes extremely powerful when compared across several periods. This financial tool, when used in conjunction with the cash position statement and the budget and profit and loss statement, will become a powerful tool for producers. Over several periods of time, the balance sheet will identify trends in the ag business that a producer can use to concentrate efforts on activities that produce a gain more efficiently than other activities that may not produce the same gains. A producer will also be aware of their financial condition without asking their accountant or, worse yet, their banker if they understand what the financial tools are telling them.
Now, not to reprimand or point any fingers, there were no correct answers to this problem proposed to the readers in March from any ag producers. The question was “What was the operating profit for Mr. Dude in September and where would it show up in the balance sheet?” There were some close answers. The correct answer was $250,200 of production profit and it shows as increased earned net worth in September compared to January.
At the same time, six of my colleagues (out of 10) questioned came up with the correct answer. Good for those six, but what is up with the other four? They are professionals and should have a better understanding of balance sheets and dual-entry accounting. See if your banker can come up with the correct answer.
We can all be better at understanding the financial data available to us and then use that understanding to improve our businesses. The good news is: There are professionals who can explain these things in methods that are easier to understand than complex or unfamiliar words.
I mentioned in the previous article that we may have lost marginal producers in the decade of 1980. My fear is that if we as ag producers don’t understand (or worse yet don’t pay attention to) these financial tools of cash position, budgets or profit and loss statements, and balance sheets, we may have marginal business managers of ag production in the decade of 2020 and beyond struggle unnecessarily. Use these tools and use the resources of professionals available to you to understand these tools.


