
Each year for over a decade, several faculty members in the University of Idaho (UI) Department of Agricultural Economics and Rural Sociology (AERS) have produced a publication called “The Financial Condition of Idaho Agriculture.” This publication is now commonly featured in the Ag Proud – Idaho January issue. Among other information, the publication reports cash receipts data for the top livestock and crops from the USDA Economic Research Service (ERS) for the previous year and provides estimates for cash receipts for the year that is just concluding made by UI AERS faculty. While this publication reports and makes estimates for total cash receipts, a distinction is not made between the relative values associated with irrigated and non-irrigated crops. The goal of this article is to provide an estimate, at least a ballpark one, for the value of irrigated (and non-irrigated) crops in Idaho as of 2021.

It turns out this exercise is, in parts, relatively straightforward, but in other ways convoluted. Let’s start with the easy stuff first. …
The USDA ERS cash receipts data mentioned are reported such that for each state they provide a ranking of the top agricultural commodities, and their associated value of cash receipts. Table 1 includes these rankings for the top 10 crops in Idaho for 2021. (Note that the top 10 crops account for around 98% of all crop cash receipts for 2019-21.)
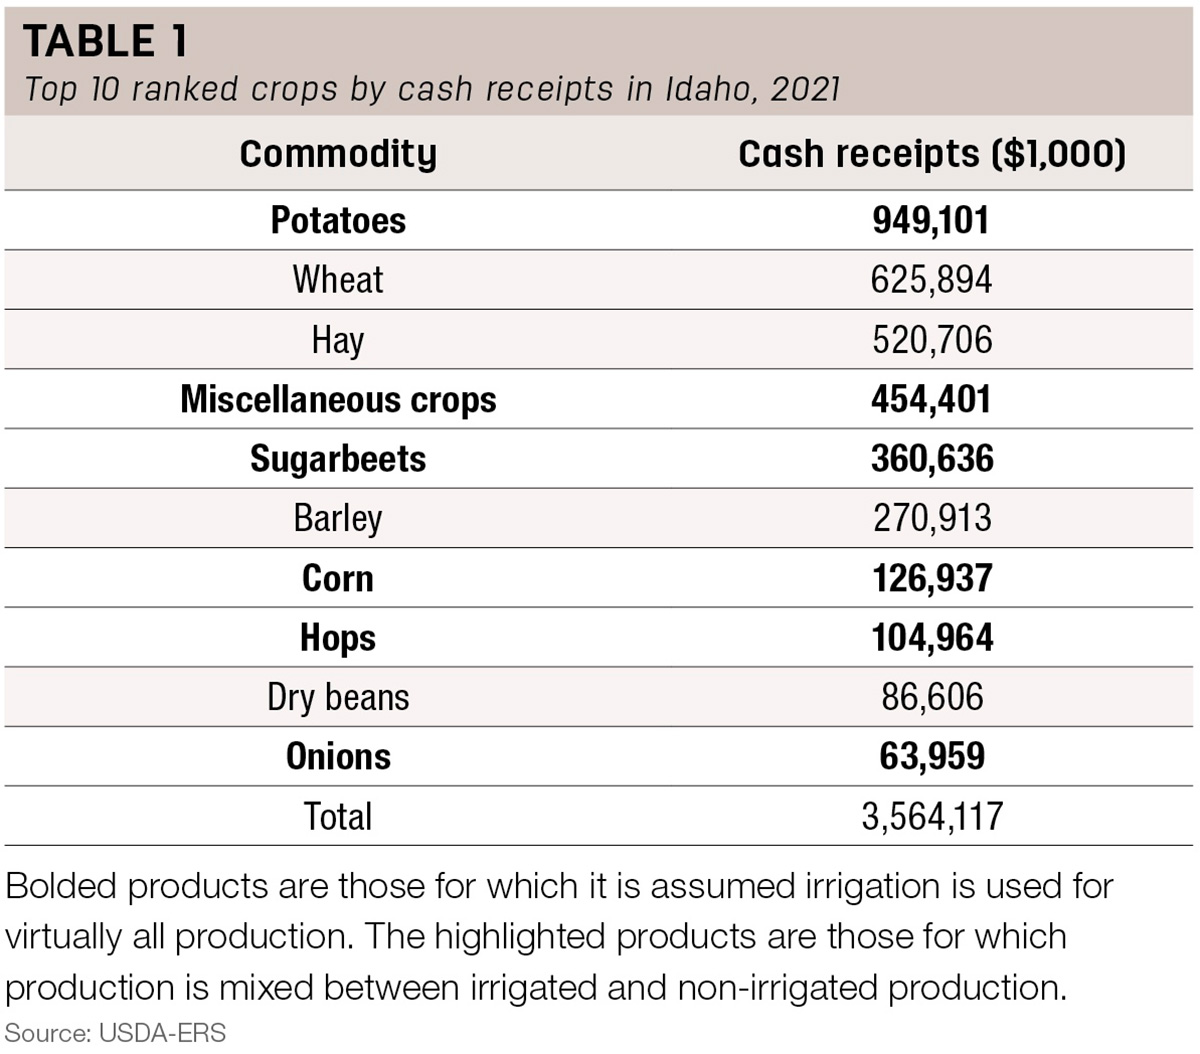
The task for obtaining the values for the fully irrigated crops is simple – just sum them up. This summation leads to an estimate of cash receipts from crops that are fully irrigated of $2.1 billion.
Coming up with an estimate for the irrigated (and non-irrigated) share for the crops with both irrigated and non-irrigated production is a bit more challenging. In a general sense, the approach used here is to determine the ratios of irrigated and non-irrigated production relative to total production, and then multiply those ratios by the cash receipts values in Table 1. Let’s go step-by-step.
Step 1: Since total crop production is the multiplication of total area harvested by average yields, a first (and somewhat of a background step) was to determine irrigated versus non-irrigated acreage. To do this, 2017 USDA Census data (the census for which data are most recently available) on total and irrigated acreage harvested were used. Non-irrigated acreage values were obtained by subtracting irrigated acreage from total acreage. Doing this assumes the ratio of irrigated to non-irrigated acreage for 2017 is close to that for 2021. This is a bit of a background step because the acreage is mainly used to determine whether the method for estimating yields, which is described next, is a reasonable approach.
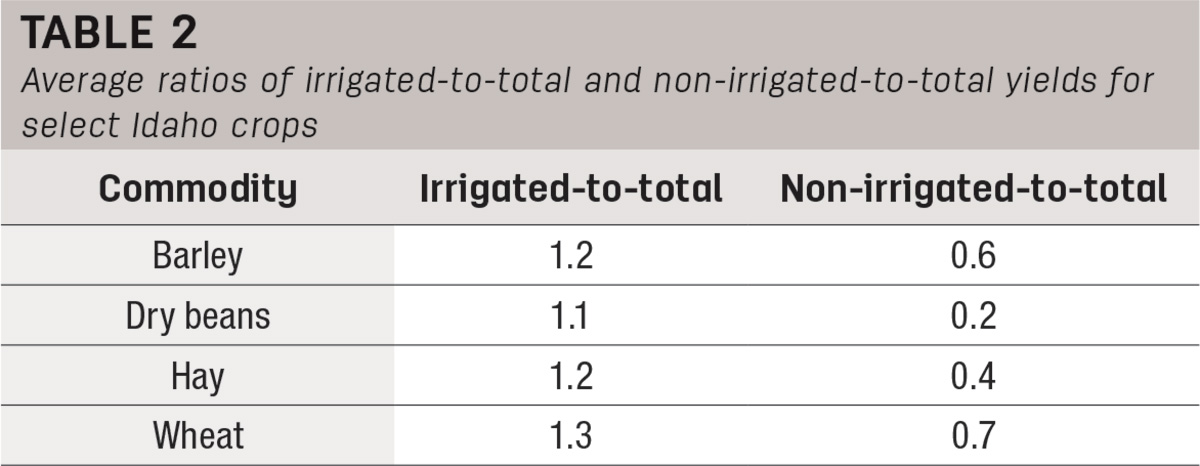
Step 2: Disaggregating irrigated from non-irrigated yields at the state level is a bit difficult and requires a few more assumptions due to data limitations. The most easily accessible statewide disaggregated yield data are from the USDA National Agricultural Statistics Service (NASS) but are only reported up to 2008. Total average statewide yields remain reported up through the current crop year. The method conducted used total, irrigated and non-irrigated yield estimates from 1990 to 2008 to calculate the ratios of irrigated-to-total yields and non-irrigated-to-total yields for each year over that period. Then, the averages of those ratios across the full period were calculated. Essentially, this yielded estimated ballpark multipliers for both irrigated and non-irrigated yields relative to total yields. For hay, irrigated and non-irrigated yields were only available for alfalfa, so those were used. For dry beans, Idaho data were not available, so those for Colorado were used.
The results from Step 2 are reported in Table 2. The results show that non-irrigated are closest to total yields for wheat, for which there is relatively more overall dryland production than is the case for the other crops.
Step 3: The next step was a validation step that combined the estimates from the first two steps to see how things look. Specifically, the ratios from Step 2 were multiplied by the 2017 USDA total yield estimates to obtain separate estimates of total irrigated and non-irrigated yields for 2017. Next, these separated yield estimates were multiplied by the separated acreage values in Step 1 to obtain estimates of irrigated and non-irrigated production. These separated estimates were then summed together to obtain an estimate of total production. These calculated values based on the method of using historical yield ratios were then compared to the actual 2017 USDA Census total production values to determine accuracy. The differences between the obtained estimates and 2017 USDA Census values ranged from 2% for barley to 4% for wheat. So, not too far off the mark. …
Step 4: The total irrigated and non-irrigated production were then each divided by total estimated production to obtain ratios of irrigated-to-total and non-irrigated-to-total production. These are essentially ballpark multipliers that represent the average amount of production from each type of cropping system. These ratios are reported in Table 3.
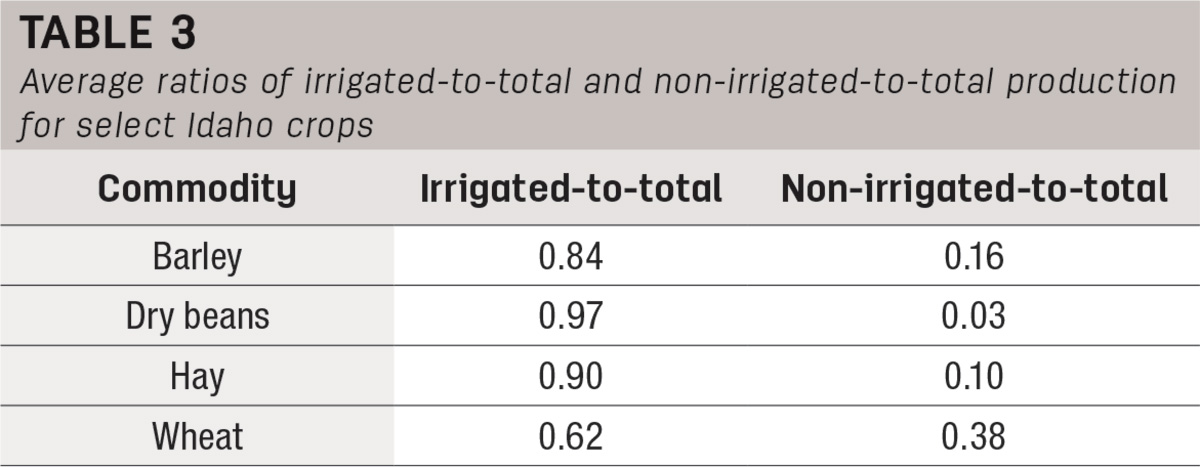
Step 5: The last step was to multiply the ratios in Table 3 by the cash receipts values for the highlighted crops in Table 1 to obtain estimates of the value of irrigated (and non-irrigated) crops in cash receipts terms. These results are displayed in Table 4.
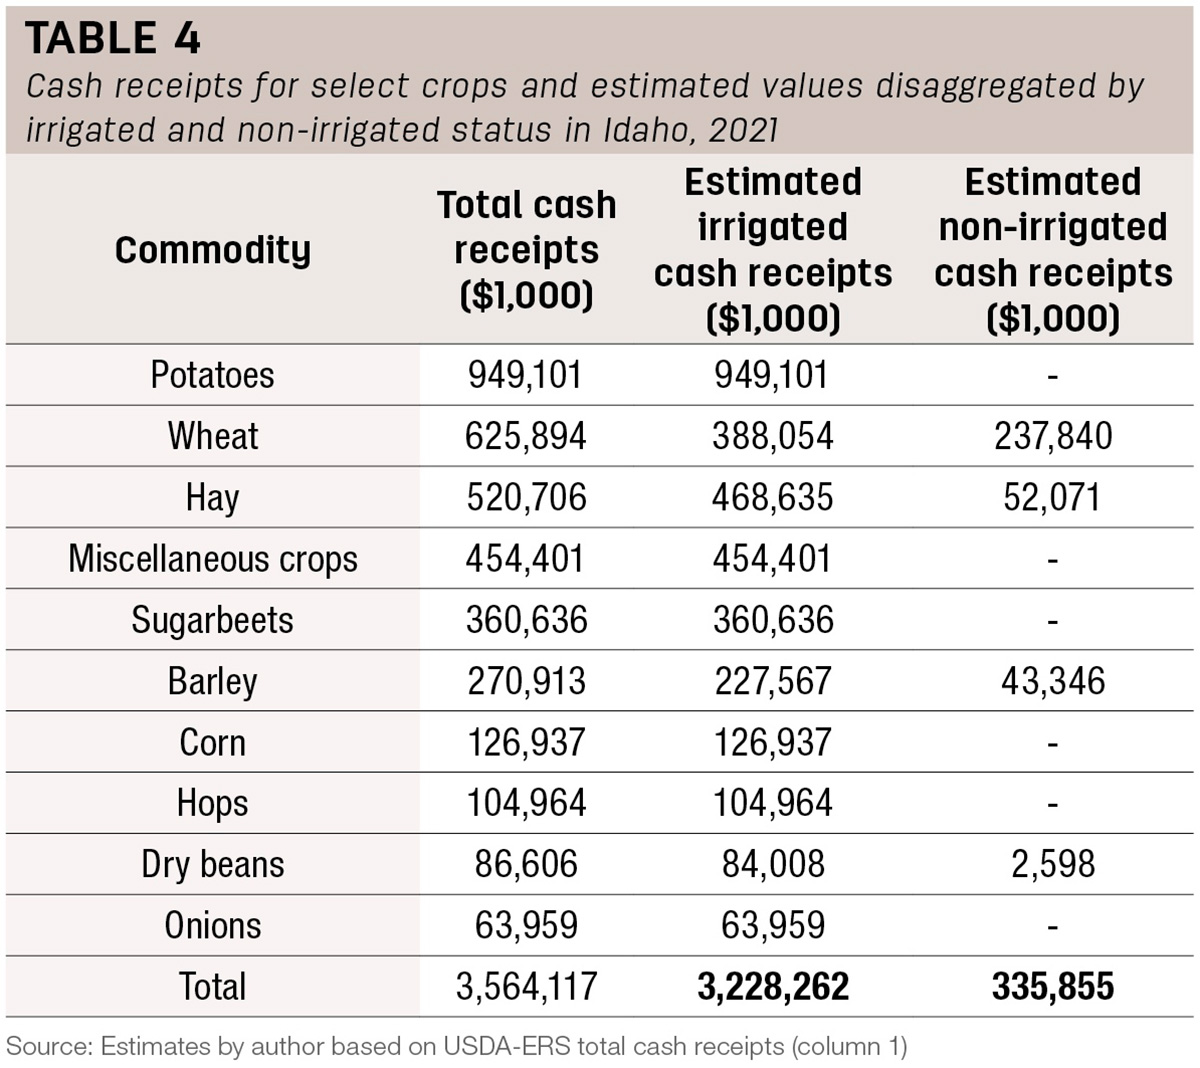
The results from the last step show that the value of irrigated crops in Idaho as of 2021 is an estimated $3.2 billion, while that for non-irrigated crops is a smaller, but still substantial value, especially for wheat, of over $300 million.
Although the exact values will change from year to year due to crop rotations, irrigation water availability, rainfall and other variables that can impact both acreage harvest and yields, the exercise in this article provides a ballpark estimate of the relative values of irrigated and non-irrigated crops as of 2021. It is important to note that all agricultural production is valuable, so best wishes for all types of producers as we head further into 2023.


.webp?height=auto&t=1783636475&width=285 "63802-Thomas-GPS-equipment--Automated-Magnum-Tractor--Matt-Skinner-photo(1).jpg")

