


Greenhouse gas (GHG) emissions are a worldwide concern as a primary driver of global warming and climate change, and dairy farmers are under increased pressure regarding the environmental impacts of their operations since dairy systems might be responsible for 4.35% of the global anthropogenic GHG emissions, according to a 2017 EPA report on GHG emissions.


The most significant sources of GHG emissions from dairies are methane and nitrous oxide from enteric fermentation, manure storage and handling, and crop systems. In addition to GHG emissions, dairy farmers are also managing the impacts of their farms regarding nitrate and phosphates in leachates and runoffs from fields that may impair watercourses and soils.
Despite all efforts of the dairy community to measure GHG emissions from all significant sources in dairy farms, monitoring and concurrently quantifying all emissions from a farm is very difficult and prohibitively expensive. Currently, the most viable option available is to rely on mathematical models. To predict GHG emissions, these models vary from the application of very simple emission factors to extremely detailed simulation platforms. These models consider physico-biological processes and complex interactions among the main components of the dairy production system.
However, most of the models available fail to reach end users and decision-makers because they often require enormous amounts of data as inputs; they need great efforts to set up, calibrate and even to run; and their results are not straightforward to understand and interpret. Therefore, frequently, existing models are too cumbersome and overwhelming for the decision-maker to use without the guidance of specialists or extensive training, and they end up being heavily research- or education-oriented.
Thus, aiming to overcome the challenges mentioned above, we are developing the DairyPrint model, which is a project supported by the University of Wisconsin – Madison Dairy Innovation Hub (DIH). The main objective of developing this model is bringing to farmers, consultants (veterinarians, nutritionists, etc.), researchers and agricultural students a high-level, simple, minimalistic, user-friendly, still powerful and scientifically sound whole-farm decision support model to assess economic and environmental tradeoffs of dairy farming for strategic nutrient management decisions. The main philosophy behind this development is to be minimalistic regarding the inputs required, avoiding complex data-retrieving efforts from the user, by focusing on the most relevant input variables. Moreover, we are working toward the development of a very user-friendly and intuitive graphical user interface, allowing the user to set up a baseline scenario and easily interact with the tool to respond to “what-if” questions. For each simulated scenario, the user will be able to explore the model interface analyzing the main outcomes in detail through interactive dashboards and simple reports. The DairyPrint model will be fully functional online.
Thus, with this article, we aim to demonstrate the functionalities of the DairyPrint model and its theoretical base and present some potential applications through the evaluation of scenarios and impacts on management practices over GHG emissions.
About the DairyPrint model
The DairyPrint model is being developed in a modular fashion, comprising the herd, manure, crop and economic modules. The herd module is the main driver and input provider for the other modules (Figure 1).
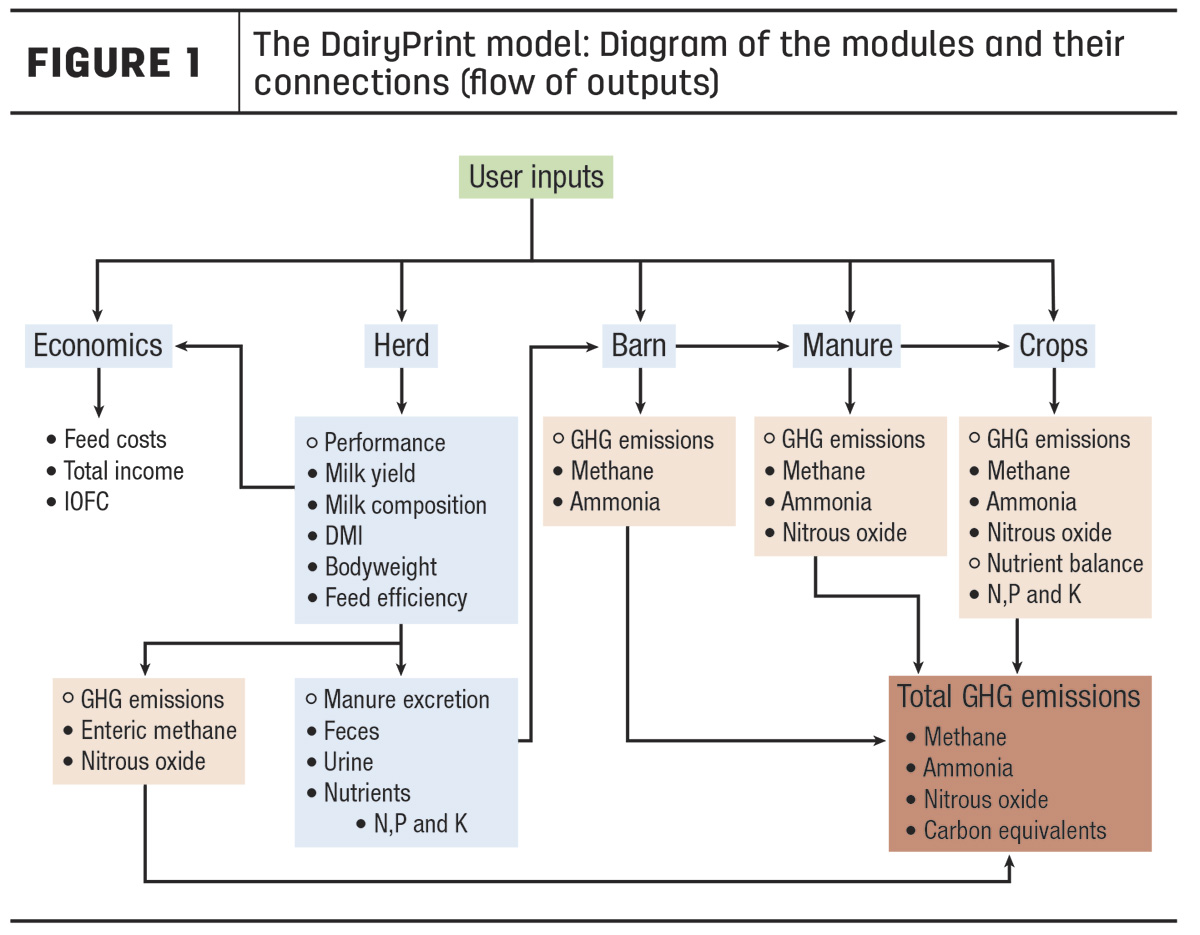
In the herd module, based on user inputs such as total number of cows, calving interval, culling rate and age at first calving, the model runs the simulations performing herd dynamics in monthly steps, estimating the herd demographics throughout the year when it reaches stability. In addition to herd demographics, milk yield curves and milk composition, bodyweight (BW), dry matter intake (DMI) and feed efficiency are estimated. These variables, in turn, are used to estimate the total mass of excreted manure, urine, feces, nitrogen (N), phosphorus (P) and potassium (K), in addition to enteric methane and nitrous oxide emissions. The equations used in the model come from well-known literature sources (e.g., NRC (2001), IFSM, etc.) and were selected based on simplicity and relevance.
From the herd module, there is a distribution of the produced outputs into the other modules, in addition to the specific user inputs for each module. The economic module receives the DMI and milk yield from the herd module so that, in addition to inputs such as the cost of diets, total income and income over feed cost (IOFC) are calculated. The barn module receives all the manure produced, and from it, along with information from weather data and type of facility (freestall or tiestall), methane and ammonia emissions are estimated. Once the manure in the barn is transferred to the manure module where the manure is handled and processed according to the practices adopted by the farm (i.e., managed in liquid/slurry, solid form, using biodigesters, etc.). The way manure is handled will affect the amount and type of GHG that will be emitted, which is captured and displayed to the user by the DairyPrint model.
After manure processing, the processed material will be distributed to the crop fields in the crop module. In the crop module, all GHG emissions are accounted for due to the application of manure and also due to the application of chemical fertilizers and limestone. In addition to GHG emissions, nutrient balances (N, P, and K) are also estimated.
It should be noted that the DairyPrint model is still under development, but it will be released soon. If you want to be part of the first group of users, please provide us with your email online, and we will be glad to alert you once it is officially launched.
Developing scenarios and evaluating methane emissions from herd, barn and manure storage
Next, we will discuss some scenarios that can be simulated in the model to evaluate a dairy farm system in Wisconsin. Greater focus is given to methane emissions from different waste management strategies.
To demonstrate the scenarios, we first set up an average herd in the DairyPrint model. For this, we considered a Wisconsin dairy farm with 150 mature Holstein cows (average weight at maturity of 680 kilograms), with a calving interval of 15 months, culling rate of 35%, age at first calving of 24 months, average milk production per cow of 40 kg/day and cows milked 3X. Cows are housed in a freestall barn in Dane County.
From this initial configuration of the herd, we designed four scenarios focused on methane emissions based on different management strategies:
- Baseline scenario: chopped straw as bedding type, slurry manure, no biodigester, manure pond emptied in the fall
- Sand as bedding type scenario: sand as bedding type, slurry manure, no biodigester, manure pond emptied in fall
- Biodigester scenario: chopped straw as bedding type, slurry manure, biodigester (30% of efficiency), pond emptied in fall
- Manure pond emptied twice a year scenario: chopped straw as bedding type, slurry manure, no biodigester, manure pond emptied in fall and spring
Inputs for a scenario simulation are displayed in the top panel of Figure 2. Just below, a dashboard with three value boxes and two graphs are the outputs from the model.
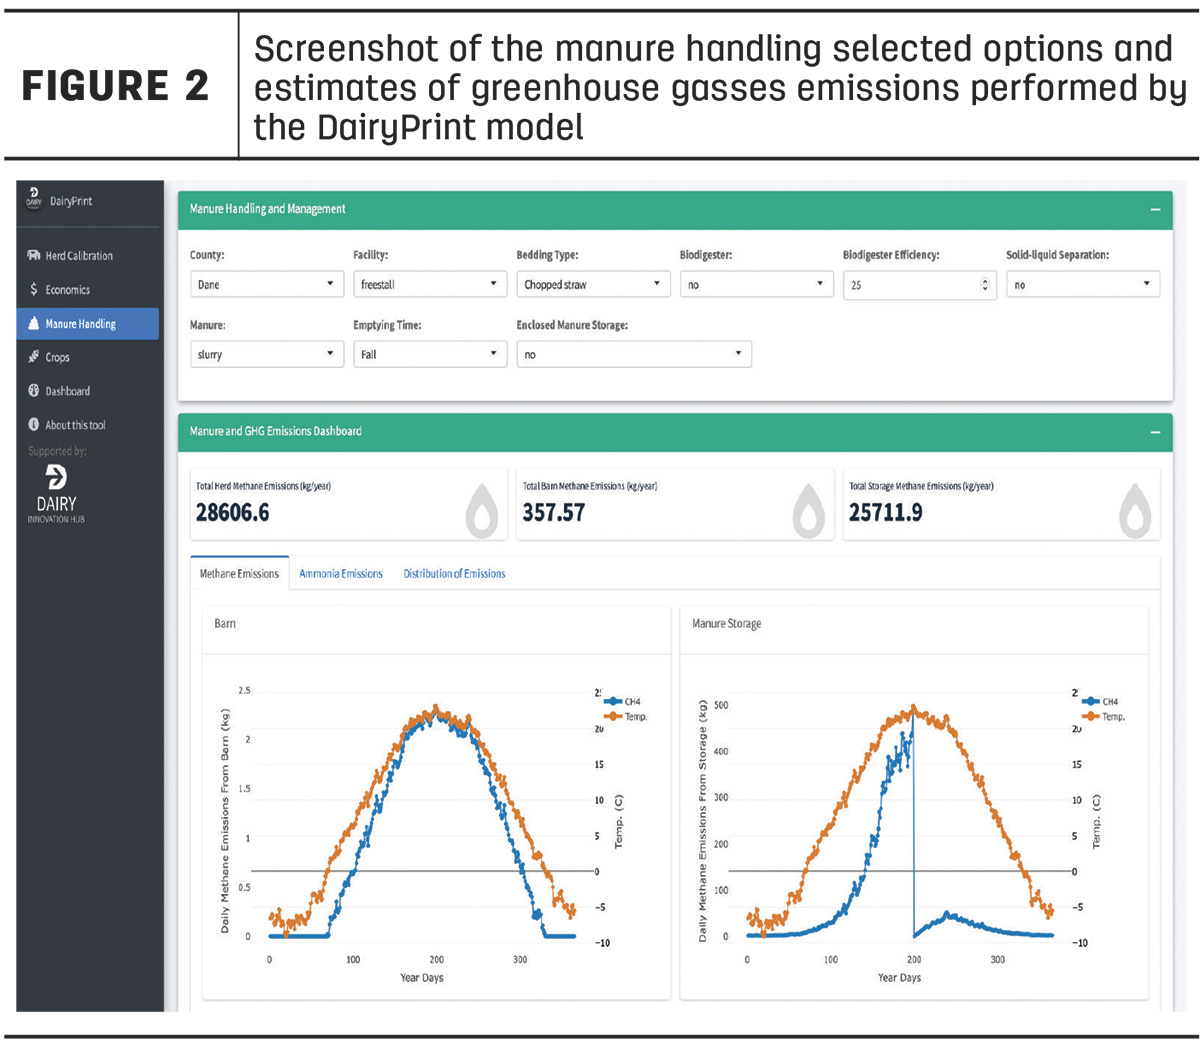
The first big number (28606.6 kilograms per year (kg/year)) represents the estimated total enteric methane emitted by the herd. The value box in the middle represents the methane emitted by the barn (357.57 kg/year). The last value on the right represents the GHG emitted by the manure storage (25711.9 kg/year). The graph on the left represents the daily methane emissions from the barn (line in blue) and the average daily temperature during the year (line in red) with respect to the days of the year (x-axis). The graph on the right follows the same logic; however, the blue line represents the daily methane emissions from the manure storage. Notice the difference of scales of emissions of the barn and emissions of the manure storage.
Interestingly, in both cases, temperature throughout the year drives methane emissions. This occurs because higher temperatures, especially in the summer, allow for greater microbial activity and consequent greater fermentation of manure volatile solids, increasing methane emissions. In addition, it can be noted that in the manure storage graph, there is a sudden reduction in emissions close to day 200 of the year. This happened due to the manure management that empties the manure pond at that time of the year, reducing the amount of organic material for fermentation and therefore methane generation.
In Figure 3, we analyzed the scenarios from two perspectives: in relation to the absolute total methane emission and with respect to the emission profile, represented by the proportions.
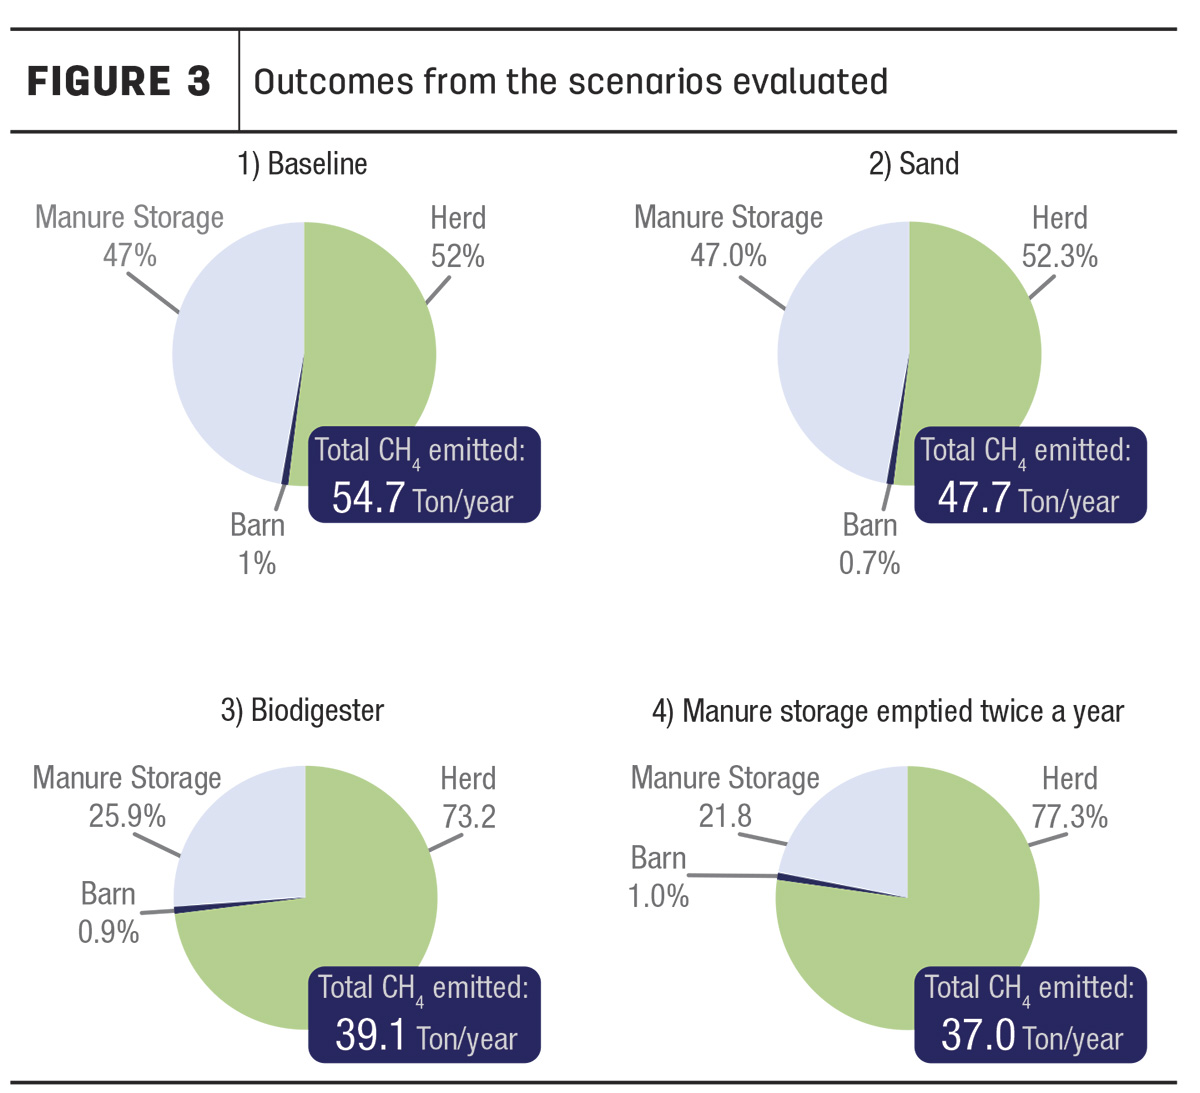
In terms of absolute methane emissions, we can see that in all the scenarios evaluated, we were able to reduce GHG emissions. However, the scenario that most mitigated methane was when the farmer decided to empty the manure storage twice a year (fall and spring, -32.5%), followed by the scenario where there was a biodigester (-28.5%) and the one that used sand as bedding (-12.8%).
The twice-yearly emptying of the manure storage significantly reduced the amount of volatile solids available in the pond, making emissions very low because with less volatile solids, less substrate was available for fermentation, and therefore less methane was produced. In the case of the biodigester, the fermentation process of the volatile solids in a controlled environment allowed the gas produced to be captured and used for other purposes on the farm, such as generating electricity or being burned to heat water. When burned, methane is converted to carbon dioxide, then returned to the natural carbon cycle, not being accounted for in GHG emissions. The reduction associated with the use of sand as a bedding type was due to the significant decrease in the amount of volatile solids reaching the manure pond, which would have the potential to be biodegraded and produce methane gas as a result.
Regarding the distribution of emissions, the proportion of enteric methane as part of the total may be greater or lesser depending on the management strategies adopted on the farm that mainly impact handling. Emissions from the barn were very low and not very significant. Although there is currently a lot of research on reducing enteric methane emissions via diets, nutritional additives, genetics, etc., we think there are low-hanging opportunities regarding potential GHG emission mitigation by better managing manure and using it as an energy source for the farm.
Although we treated the scenarios in a segregated way, combinations are possible and encouraged and would further reduce methane emissions. It is worth mentioning that in the simulations we focused on methane, but there are other gasses that can be emitted (i.e., ammonia and nitrous oxide), which must be accounted for in the farm's total emissions.
Take-home messages
Our main objective was to demonstrate how simulating farm-specific characteristics and potential scenarios with the DairyPrint model is easy, straightforward and meaningful.
Thus, assessing the environmental impact of dairy farms using the DairyPrint model could be much easier and still robust and effective. The tool will soon be available to the public through the UW Dairy Management web portal. Stay tuned or provide us your email to be alerted as soon as it is released.


