
The current economic situation in the U.S. is like the 1980s in some ways. I was too young to remember what happened then, but I have heard stories about it all my life. Skyrocketing inflation, stagflation and sky-high interest rates put a lot of farmers and ranchers out of business back then. The financial risk of producing crops and livestock was more than many families could withstand.

In other ways, the situation we face now is different. Interest rates are much lower, for example. The U.S. agricultural economy has changed as well. There are fewer but larger farms and ranches today. Most are highly specialized and automated. There are fewer small, diversified family operations than there were 40 or 50 years ago. In addition, U.S. agricultural products are exported around the world. Trade barriers have been removed, and globalization has changed the way we do business.
Input costs and commodity prices
Input costs today are extremely high. Producers have experienced rapid increases over the past 12 months. According to Progressive Farmer and DTN, phosphate fertilizer prices have increased 82% to 88% during the past 12 months. Potash prices have more than doubled during the same time frame with a 127% increase. Nitrogen fertilizer costs have increased the most. Anhydrous prices are over $1,100 per ton, up 163%. UAN28 and UAN32 prices are up 162% and 144%, respectively. Prices for 10-34-0 increased 54% from a year earlier. Diesel fuel prices have jumped 62% on a national level, while gasoline prices rose 51% over the last year. Labor costs have likely increased by 15% or more for many operations. Costs are up for machinery and equipment, repairs, chemicals, utilities and nearly every other category.
Commodity prices are strong for some crops and livestock but not so strong for others. Have prices risen enough to cover your cost of production increase? That is a very difficult thing to keep track of nowadays. In the past, a 2% to 3% increase in your annual cost of production would likely have kept you in business. Commodity prices and input costs have been extremely volatile this year – it would be easy to get blindsided by input cost inflation.
Inflation risk
I chose to write about this topic because the risk of inflation is on every producer’s mind. The Consumer Price Index (CPI), which is the most common measurement of inflation, has increased 6.2% over the past 12 months. That is the largest increase in over 30 years. Typically, the CPI increases between 1% and 2% per year. Some believe inflation can be managed by fiscal policies before it gets out of control. I certainly hope so, but the M1 money supply chart illustrated in Figure 1 makes me extremely skeptical.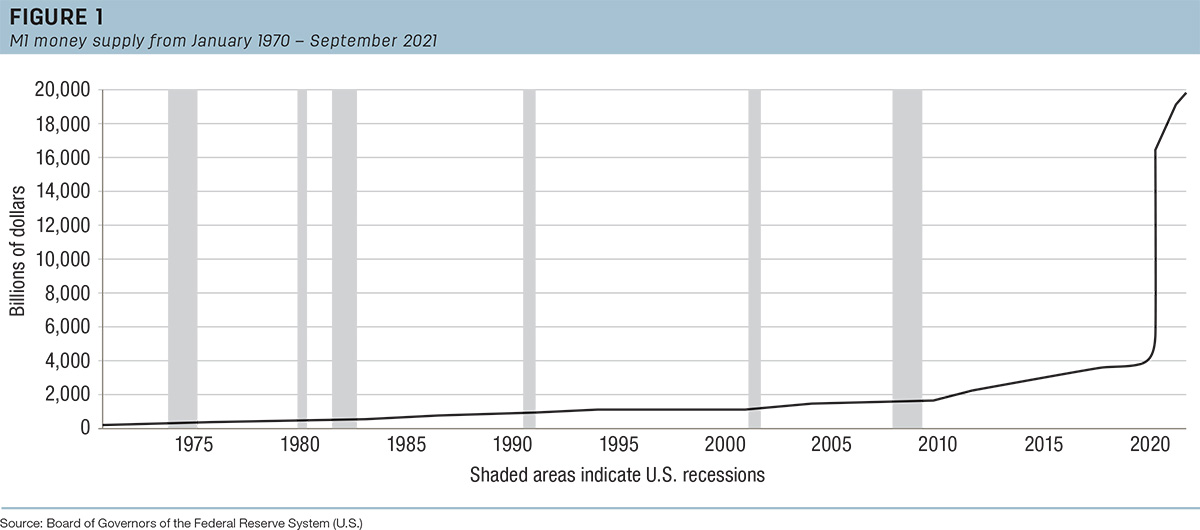
Figure 1 shows the M1 money supply from January 1970 to September 2021. The M1 is a measurement of the total amount of currency in circulation in an economy. It is used to assess the most liquid part of the money supply. It is comprised of four categories: physical currency, demand deposits, travelers checks and other checkable deposits. It does not include money in savings accounts or bonds. The vertical gray bars on the chart show economic recessions.
Some sources indicate the M1 is no longer used as a guide for U.S. monetary policy because it lacks correlation with other economic variables. I think it is an interesting way to illustrate how much money U.S. policymakers have injected into the economy over the last several months.
Here’s a quick rundown. In January 1970, the M1 money supply in the U.S. economy totaled $206.2 billion. After 1970, the M1 money supply increased at a steady but relatively slow pace for the next four decades. It exceeded $2 trillion for the first time in August 2011, then rose at a steady but faster rate until it reached $4 trillion in January 2020. In early 2020, the government began pumping money into the economy as part of its pandemic relief program. By September 2021 (that’s as far as the Fed has released data as of press time), the M1 money supply in the U.S. economy had reached $19.9 trillion. The government has recently passed legislation that could increase the M1 money supply by several more trillion dollars within the next few months. This type of central planning, financial policymaking has created a situation unlike anything we have experienced before.
This is like the 1980s
The inflation situation we face today is different. Nobody knows for sure how this will play out. Farming and ranching businesses have adapted and evolved over the last 40 years. That process will continue. What can we do as farmers and ranchers to adapt quickly and manage the financial risks we are likely to face in the future? Perhaps we should look to the past. We would be wise to visit with our parents, grandparents and neighbors about how they managed through the 1980s farm financial crisis. How did they do it? They did it with a sharp pencil, optimism, faith, family, hard work and stubborn determination. Our situation may be different than it was in the 1980s – but most likely, the solutions are the same.


.webp?height=auto&t=1783636475&width=285 "63802-Thomas-GPS-equipment--Automated-Magnum-Tractor--Matt-Skinner-photo(1).jpg")

