Although 2012 brought many challenges, some herds saw remarkable improvements compared to 2011. Midwestern states endured record temperatures for a prolonged period of time followed by a drought, impacting feed availability, price and quality.

With a combination of challenges, how did dairy producers manage their way through and achieve the production gains we saw in 2012?
Sounds like a simple question, but the answer is far from that. There can be many different reasons. The focus of this article is to look at the role of DHI data and how the new generation of DHI reports can provide important information to make either major or minor management adjustments in response to changing circumstances.
Background
Historically, DHI information has been associated with cow attention lists. These lists, created with test-day data, address a short-term need, such as cows to breed, treat, dry-off or sell.
Cow attention lists will always play an important role in day-to-day management; however, a new generation of tools is required if we hope to better understand how overall areas of herd management are performing and how changes in management, weather, price, genetics, technology, etc., impact the bottom line.
DHI information has evolved into reports that provide analysis of specific herd management areas, using innovative ways to slice and dice individual cow information.
In addition to analytical tools, the next generation of individual cow or heifer reports will consist of multiple measures of individual cow performance and more complex methods of data analysis. These reports are generally referred to as decision support tools.
Individual cow or heifer data is used in innovative ways to generate summarized data using group averages or distribution charts. Analysis tools can present this information in tables and graphs on a single herd.
Decision support tools generally use calculated values of individual animals and split cows into quartiles and make use of highlights to focus on outlier animals.
Combining the individual herd information and generating summarized data across multiple groups of herds is referred to as benchmarking. Benchmarks can be a useful tool to measure how a specific herd management area in your herd compares to other herds.
Reviewing benchmarks can provide valuable insights into what the differences in key performance measures are between two different groups of herds.
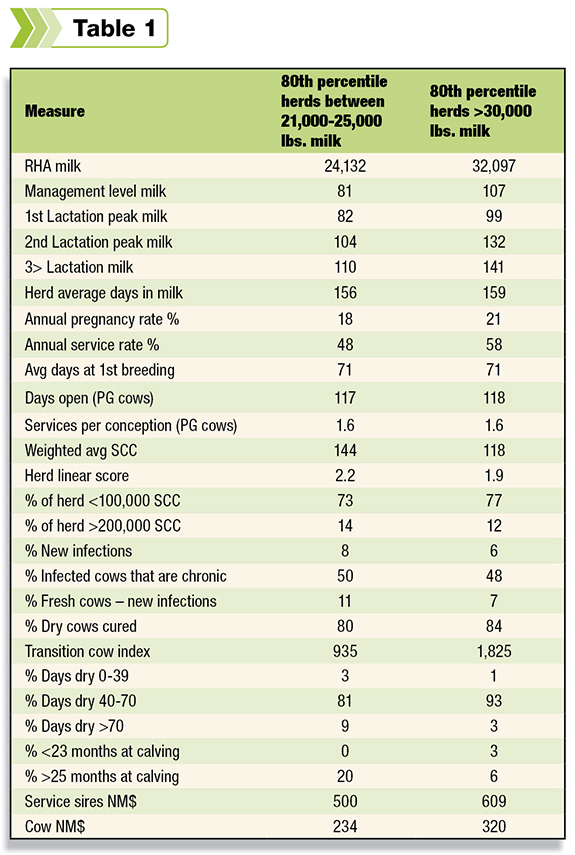
Table 1 provides an example showing the differences between the 80th percentile of Holstein herds producing between 21,000 and 25,000 RHA milk and herds producing over 30,000 RHA milk.
Table 1 shows that top-producing herds with a high rolling herd average milk tend to have some key performance measures that differ from top-producing herds at mid-level areas of production.
Not only do we see differences in average values, there are other important measures that point at consistency in management.
For example, the percent cows with days dry between 40 to 70 days is significantly higher on herds producing more than 30,000 pounds of milk.
Using benchmark data at the individual herd level
A herd analysis tool can compare a single herd to benchmark values and use research information to turn the differences into dollar opportunities.
Using the information presented, producers can work together with their team of consultants to identify which management changes can be made to improve the bottom line.
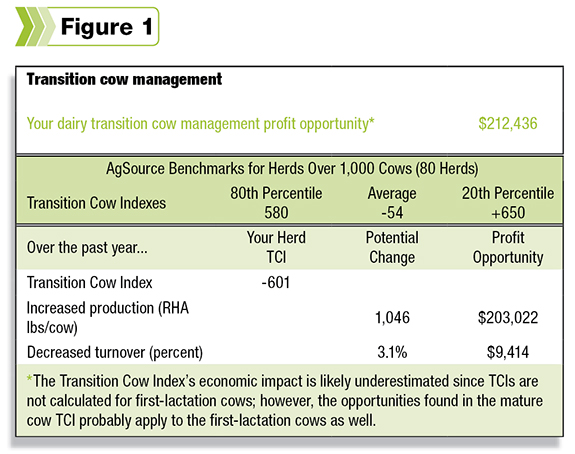
Figure 1 shows an example of the transition cow management summary.
In Figure 1, a herdâs transition cow management program is compared against herds with more than 1,000 cows. The herdâs transition cow index (TCI) value is -601, while the TCI value for the 80th percentile benchmark herds is 580.
Based on the difference between the benchmark and the herd TCI value, there is an opportunity to improve transition cow management. Combining this opportunity with research data translates, on this herd, to 1,046 pounds of milk and a reduction in turnover by 3.1 percent.
Based on the herdâs reported milk price and replacement costs, there is a $212,436 opportunity.
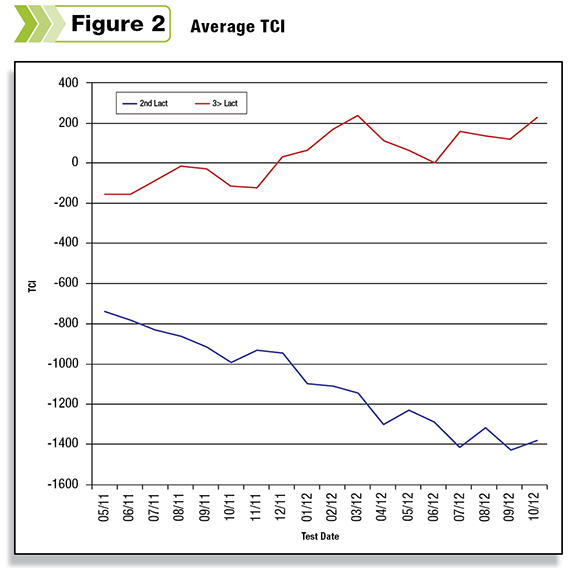
Figure 2 provides additional detail showing how the TCI value has improved for older-lactation cows but decreased for second-lactation cows.
Using the data provided in this analysis, improving transition cow management in first-lactation cows to second-lactation cows provides the greatest opportunity to improve revenue.
Summary
Producers have made use of a variety of the new generation of DHI analysis reports and decision support tools not only to make day-to-day decisions but also to make important long-term management decisions that will allow them to quickly seize on opportunities identified in the reports.
Combining the information presented in the reports with a regular review by a team of consultants will allow the producer to stay on top by making high-level management decisions to maximize opportunities in the areas of production, udder health, reproduction and genetics. PD

Robert Fourdraine
Vice President of DHI Operations
AgSource