


The easy answer to this question is yes, but the deeper question is: How much improvement are you making, and could you be making more? For the vast majority of producers, improving the genetics of offspring starts with the selection of A.I. service sires. On the sire side, decisions have to be made about which traits to select for, what minimum or maximum values you wish to consider and how much you wish to spend on a unit of semen.

The dam’s contribution to genetic improvement of the next generation is controlled by selecting which animals are bred to dairy A.I. semen and which will be bred to beef semen or not bred at all.
Once you know which cows to breed to dairy A.I. semen, it becomes a process of matching the right unit of semen with the right cow while taking into account issues such as inbreeding. A good mating program can take care of that.
Once mating decisions are made, how do you know they will translate into the improvements you are seeking?
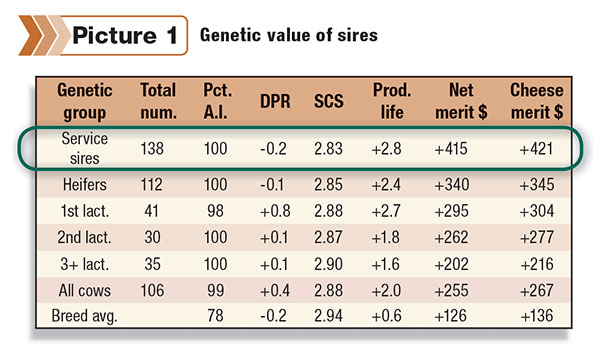
One way of getting that answer is by looking at the genetics of the service sires your cows and heifers were last bred to each month and ensuring those values meet your expectations. A convenient place to find that information is your DHI Herd Summary report ( Picture 1 ). By comparing test-day reports over a period of time, you can build a view of the progress you are making.
Although using your DHI Herd Summary is an option, it may give you an incomplete answer because you do not have information on other herds to compare against; plus, there may be traits you value missing in the analysis.
How do I compare to other herds?
To answer this question, we should take a look at what levels of genetic improvement are being realized in the industry. To do this, 3,500 AgSource Holstein herds’ Service Sire Net Merit Dollar (NM$) values were analyzed over a three-year period and averaged based on the month of test.
Data was broken up into five groups. These groups were based on the percentile ranking from top to bottom of the last test-day Service Sire NM$ value for the herd. Figure 1 shows the three-year trend in NM$ values for Holstein herds’ service sires for the five different groups.
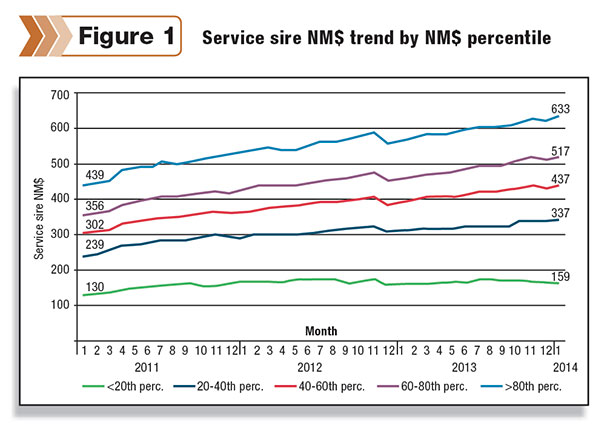
In reviewing the above graph, the top (higher than 80th percentile) herds, based on Service Sire NM$ values, improved their NM$ value over a three-year period by nearly $200, going from $439 to $633. Although the four other groups showed progress, their rate of improvement is much lower.
Since NM$ calculations include multiple traits, a look at some of the traits that are part of NM$ is very useful for comparison as well. Figure 2 shows the improvement in Service Sire PTA Daughter Pregnancy Rate for the same five groups listed in Figure 1.
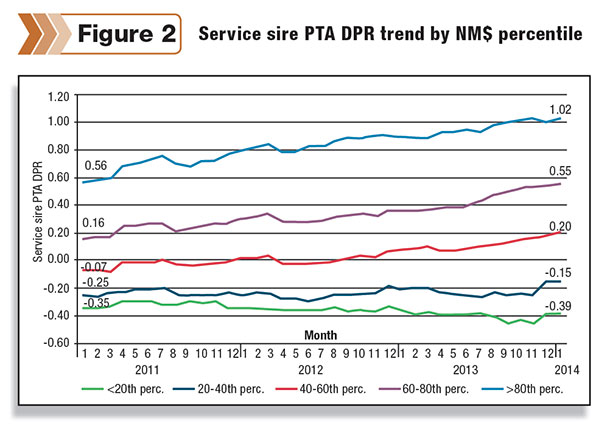
Similar to the Service Sire NM$ trend, the higher-than-80th-percentile group for Service Sire NM$ also shows the largest improvement in Service Sire PTA Daughter Pregnancy Rate; however, the two lowest groups for Service Sire NM$ show little or no improvement.
Since we used Service Sire NM$ in this analysis to define the five groups of herds, for producers selecting their A.I. bulls based on NM$, the higher-than-80th-percentile trend line would be a valuable number to benchmark against. For those herds not using NM$ as a selection criteria, similar groups can be created for other traits such as Cheese Merit $, PTA Protein, etc.
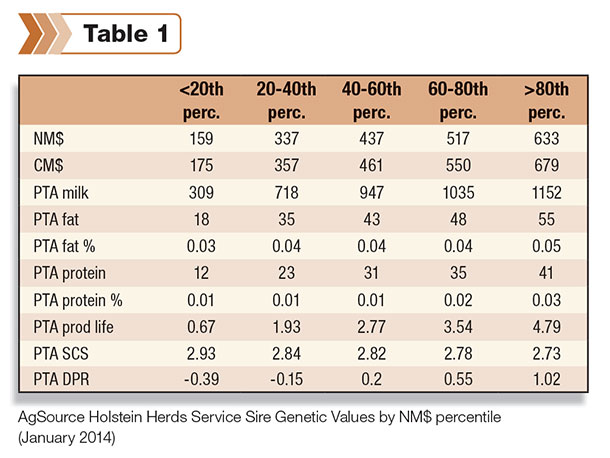
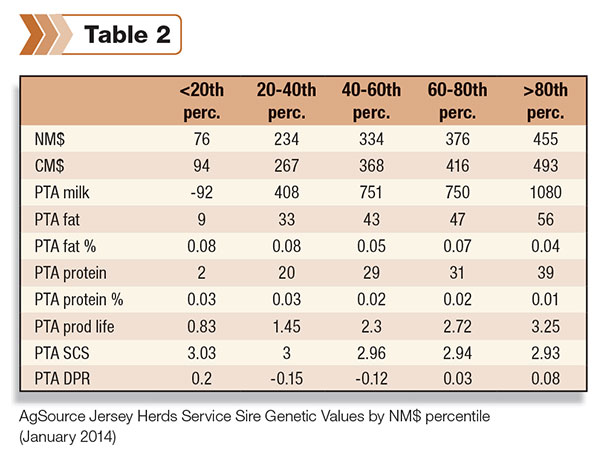
Table 1 provides producers a quick overview of current (January 2014) genetic values for five groups of herds broken out by Service Sire NM$ values. Although this does not provide a three-year history, it is a good start to compare your herd’s current service sire values with other Holstein herds. Table 2 provides the same data for Jersey herds.
Are there any areas of concern in my herd?
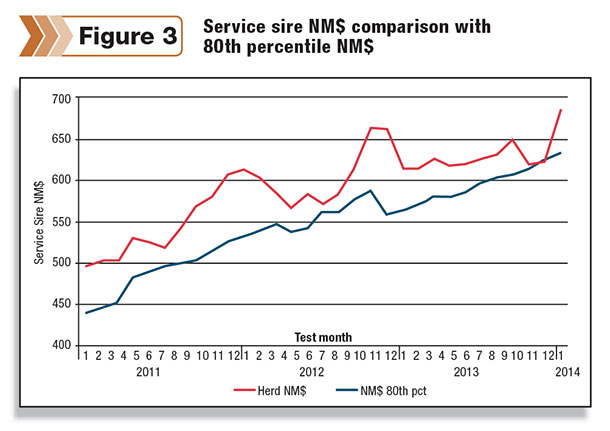
This is the second question that a producer needs to look at. Figure 3 shows an example of a herd that outperforms the higher-than-80th- percentile herds for Service Sire NM$. On face value, this herd is doing an excellent job, and based on NM$ alone, one would expect there is little improvement to be made.
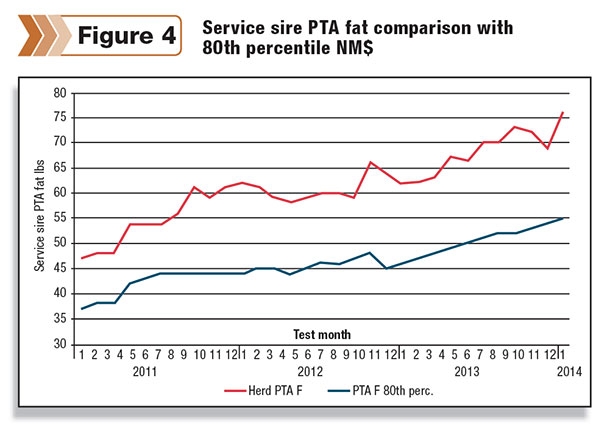
When reviewing the production traits, it is apparent that tremendous progress has been made in the production area. As shown in Figure 4 , the Service Sire PTA fat pounds greatly exceeds the top herds; however, there is a problem with Service Sire PTA Daughter Pregnancy Rate and PTA Productive Life.
When you look at the data in Figures 5 and 6 , the herd had been making reasonable progress on selecting service sires that improve PTA Daughter Pregnancy Rate and PTA Productive Life; however, in early 2012, these values started coming down.
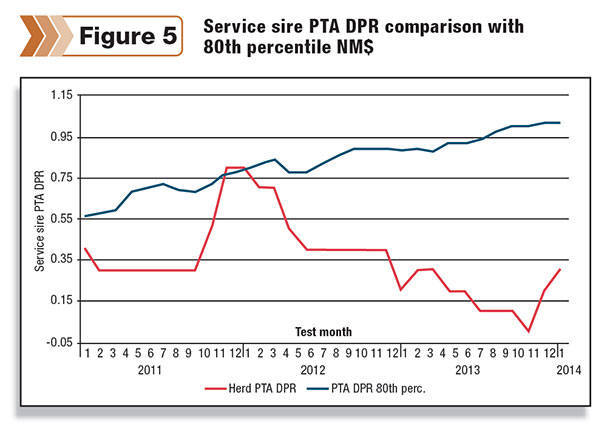
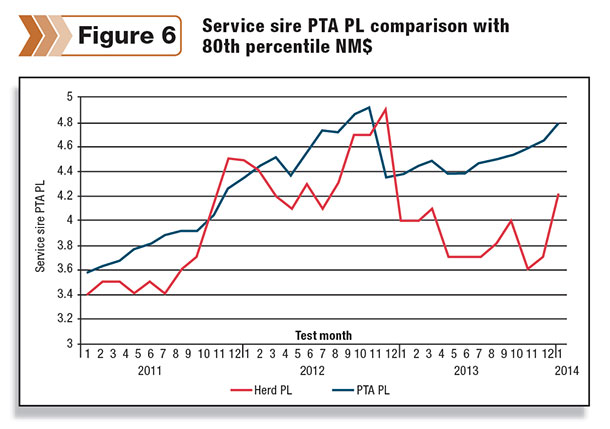
Although improvements in production traits have been excellent in this herd, the trend for PTA Daughter Pregnancy Rate and PTA Productive Life in this herd should raise a concern.
To ensure future expectations are met, it is wise to meet with your A.I. representative and review the traits you are currently using to select A.I. bulls and re-evaluate if you need to add criteria or change some of the traits included in the selection of your service sires.
Summary
In summary, reviewing the genetic values of your service sires, based on the last breeding, can provide you a quick overview of the expected genetic improvement of your next generation of dairy cows. Comparing individual traits over a period of time against benchmarks will provide you with a tool to track progress.
It all starts with accurately entering breeding data and providing this to your DHI technician so DHI reports can be generated showing your herd’s values. This will allow you to track progress over time and compare individual progress to herds of similar size through benchmarks.
This is the only way you can know for certain that you are making genetic progress with each generation and whether or not you could be making more. PD
Robert Fourdraine holds a Ph.D. in animal science from Texas A&M.

Robert Fourdraine
Vice President of DHI Operations
AgSource Cooperative Services


