Dairy nutritionists have three options available for feed fat analysis: total lipid analysis (sometimes referred to as ether extract), acid-ether extract and fatty acids. Each differ in cost and the information they provide. Generally speaking, a total lipid or ether extract analysis is most economical.
The most expensive is the fatty acid analysis, and the intermediate between the two is acid-ether extract.
A total lipid analysis includes fatty acids, which are the building blocks of the lipid material and the fraction that contains high energy. When conducting a lipid analysis, nutritionists should expect to get back information that reflects the high-energy component of the diet.
However, the total lipid analysis also includes non-lipid contaminants, many of which will have little or no energy value, making ether extract not very exact in determining energy available to the cow.
Next, the acid-ether extract analysis was developed for extruded feeds or commercial calcium salt supplements. The lipid is bound in a manner that makes it difficult to extract unless it is first released with the acid. But like total lipid, it also includes the fatty acids as well as non-lipid contaminants.
The third choice, fatty acid analysis, which excludes the non-lipid contaminants, gives a report only on the fatty acids – the high-energy part of the lipid and the best predictor of animal performance.
Basic lipid components
The compounds extracted in ether extract can be categorized as lipids or non-lipid contaminants. Lipids contain nonglycerol-based lipids such as waxes and alkanes on plant leaf surfaces. They are important to the plant because they prevent water loss and penetration of pathogens. However, the waxes and alkanes have very low digestibility by cows and therefore don’t contribute to energy intake.
Glycerol-based lipids include triglycerides, phospholipid and galactolipids, all of which have fatty acids attached to them. Triglycerides are the primary lipid component found in cereal grains like corn and barley. Galactolipids are the primary glycerol-based component found in forages and hays.
Example from the lab
As an example, four samples of corn, alfalfa, a dairy TMR and a commercial Ca salt were submitted to three commercial laboratories for the total lipid (ether extract) analysis. A fourth lab conducted an acid-ether extract analysis on the same four samples. See the results in Table 1.
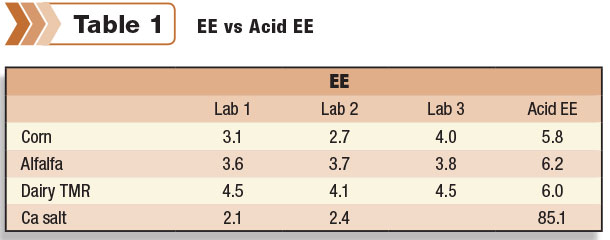
While the corn results for ether extract varied quite a bit among the three labs, the results were fairly consistent for alfalfa at 3.6 to 3.8 percent and the TMR at 4.1 to 4.5 percent.
The calcium salt supplement was very low at 2.1 and 2.4 percent total lipid despite being a commercial supplement with more than 80 percent fatty acids and the remainder mostly calcium. The fatty acid and calcium are bound together to prevent rumen problems but are resistant to extraction in a total lipid analysis.
When looking at the acid-ether extract analysis, the numbers are always higher than the ether extract because pre-washing the sample with acid releases more compounds from the plant. Pre-washing with acid was especially important for the Ca salt product to release the fatty acids so they can be counted as part of the total lipid.
Total lipid is by far the most economical but provides information that has limited use because it contains non-lipid contaminants. Fatty acids analysis is most expensive but provides the information that’s the most relevant in predicting the energy value for the feed supplement as well as individual fatty acids that may be useful in diagnosing animal performance.
The fatty acid analysis of an example dairy TMR shows that total lipid or total fat by ether extract was not requested in the analysis, nor was fat by acid hydrolysis, but only total fatty acid analysis. Results showed the sample of the dairy TMR was 3 percent total fatty acid as sampled or 5.54 percent fatty acid on a dry matter basis.
Fatty acids shown in an analysis report often include both the fatty acid abbreviations and the fatty acid name. The abbreviations for fatty acids are based on the length of the fatty acid chain and the number of carbons in the chain; C12:0 means it’s a 12-carbon chain, and the number after the colon is the number of double bonds in the chain.
If the number is zero, you know it is a saturated fatty acid. If it’s not a zero, it is an unsaturated fatty acid. C18:2 (linoleic acid) is one of the most common unsaturated fatty acids found in dairy feeds.
Fatty acid analysis to help diagnose milkfat depression
Looking at the example fatty acid report from a commercial lab, we take the three targeted unsaturated fatty acids (18:1, 18:2 and 18:3) and add them up as expressed as the percent of the sample dry matter, not when expressed as a percent of the total.
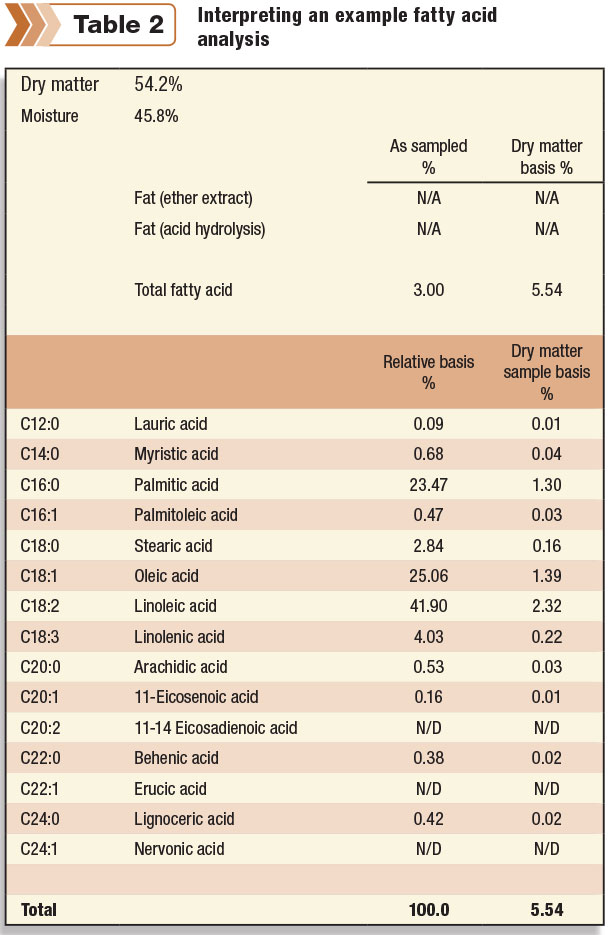
This gives us the rumen unsaturated fatty acid load (RUFAL), which is a measure of whether the diet is relatively high or low in fatty acids. I use 3 percent as the cutoff to indicate when dairy TMRs are on the high-risk side or on the lower-risk side.
A RUFAL higher than 3 percent doesn’t immediately indicate it’s a problem, but nutritionists need to determine where that fat is coming from. If it is from mostly commercial bypass fat supplements, there’s no reason to be too concerned. However, risks are higher if it’s coming from distillers grains or byproduct feeds. These create more of a concern.
It’s not that these unsaturated fatty acids cannot be fed, it’s that they cannot be overfed. That’s why we monitor the amount the cow is consuming each day from all sources – not only from fat supplements but all grains and forages as well.
If the RUFAL is below 3 percent, it’s on the low side and not necessarily the main contributor to milkfat depression. Get your feed and TMR analyzed for fatty acid so you can get your RUFAL number to know your relative risk.
When producers use high-fat feed ingredients, such as distillers, they can’t be sure of the actual fat content. Those levels can vary significantly. It’s wise to test the composition of corn co-products. The percent fat in those products can vary month to month and can affect the energy available in the TMR as well as influence the impact it will have on the rumen microbial population and animal performance.
Nutritionists also should test forage fatty acid variations. Research in the Netherlands and the U.S. showed fatty acid as a percent of dry matter in grass silage and corn silage can vary from as little as 0.8 to 3.6 percent. There is more than a threefold spread in the amount of fatty acid present in corn silage.
Because corn silage is such a large proportion of dairy diets, it can be a significant contributor to the total unsaturated fatty acids consumed by an animal and raise the risk of milkfat depression. PD
Thomas Jenkins is a professor emeritus with Clemson University.