


Editor’s note: This is the second of four articles explaining producer payment systems for milk in the U.S. In the June 12 edition of Progressive Dairyman, I provided an overview of the producer milk payment systems in the U.S.

This article will review the payment mechanism for the largest of the component payment systems – the Federal Milk Marketing Order’s (FMMO) component pricing system. Subsequent articles will review the FMMO’s advanced payment system and the California payment system.
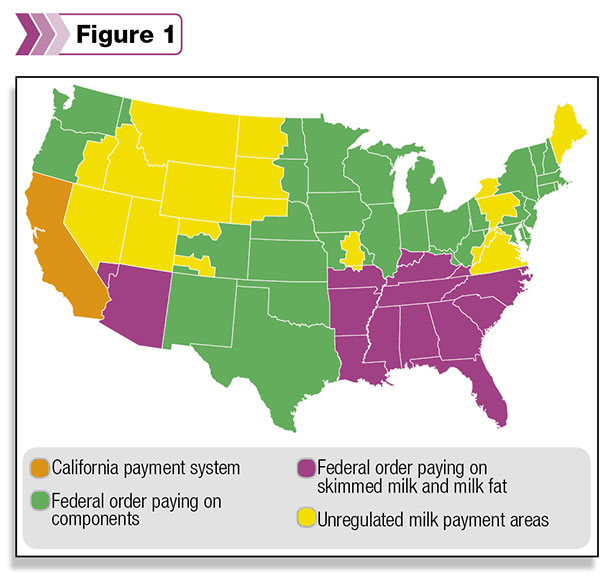
The component payment system provides payment to the majority of U.S. producers. There are six federal orders included in this payment system: the Northeast, the Mideast, the Upper Midwest, the Central, the Southwest and the Pacific Northwest. The largest by far is the upper Midwest, which includes Wisconsin, Minnesota and small parts of Illinois, Iowa and the Dakotas (see Figure 1).
 The payment system in these six orders is meant to reward producers for components – not water. The system is also aligned to provide reward for the components needed to make cheese. The most important component for cheesemakers is casein protein because casein protein is needed to coagulate and trap butterfat in the cheese-making process. (Casein protein makes up 80 to 82 percent of the protein in cow’s milk.)
The three components that make up the payment in the component system are “true” milk protein, butterfat and “other solids.” The word “true” is key. The amount of protein is often determined by the nitrogen content.
This method is typically called “total” protein. Determining protein by the nitrogen content overstates the amount of protein by about 5 percent. The majority of numbers we see for protein content (e.g., packaged food labels) are based on total protein. The U.S. component system pays based on true protein.
The producer’s payment is based on his components as they are valued by their processed value. The value of the component is determined by formulas that link the wholesale value of cheese, butter and dry whey to the individual milk components. In all cases, the component values determined by the formulas are based on the wholesale price of cheese blocks and barrels, the churned price of butter and the dried price paid for whey solids.
The value of the underlying commodities is determined by the National Agricultural Statistics Service (NASS). While the NASS numbers trend very closely with Chicago Mercantile Exchange (CME) prices, which are based on real trades, CME prices represent less than 1 percent of dairy product movements and are considered to be too small a sample to be representative.
In addition to payment for these components, producers receive payment for the “producer price differential,” which will be defined later, and in the four central U.S. orders, producers receive an additional bonus for a low somatic cell count. The basis for payment of the somatic cell count bonus is also based on the NASS price of cheese.
Also, many producers are paid an additional bonus, above the minimal required by the federal order for higher levels of protein in their milk.
The formulas
Two of the three component formulas are pretty straightforward. The formula for protein is a little more complex.
Butterfat is based on the price of butter less the cost to churn it into butter times a yield factor, which is primarily an adjustment for the salt and water in butter. The formula is shown below.
Butterfat = (Butter price per pound - 0.1715 per pound) x 1.211
Similarly, the value of other solids is based on the commodity price for dry whey less the cost to dry the whey times a yield factor. Dry whey was chosen because it contains the solids not in cheese (e.g., lactose and minerals and the non-casein protein), which pass through the cheesecloth in the cheese-making process.
Other solids = (Dry whey price per pound - 0.1991 per pound) x 1.03
However, when it comes to the value of protein, the formula gets a bit more complicated. There are two parts to the formula. The first part represents the value for protein based on the cheese price. It follows the familiar method of subtracting the make allowance from the cheese price and multiplying times a yield factor.
First part of protein formula = (Cheese price per pound - 0.2003 per pound) x 1.383
The second part of the formula gives protein an added value because butterfat is typically worth more when it is in cheese than when it is in butter. This adds significantly to the value of protein. The rationale for this is that without the protein, the butterfat could not have been included in the cheese. Together, the full formula for pricing milk protein is as follows:
Milk protein = (Cheese price per pound - 0.2003 per pound) x 1.383 + (((Cheese price per pound – 0.2003 per pound) x 1.572) – (butterfat price per pound x 0.9) x 1.17)
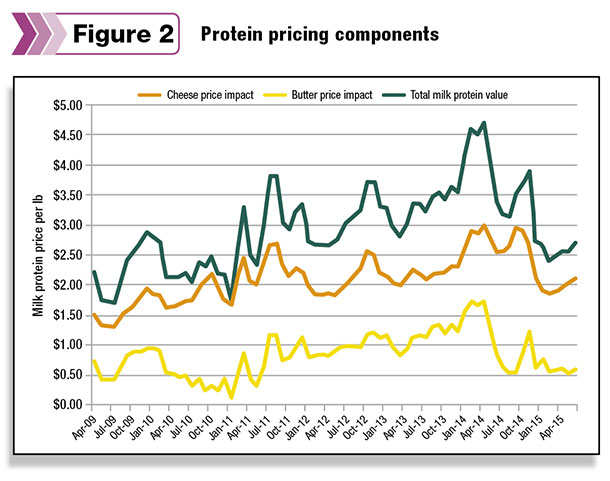
The latter part of the formula creates an interesting dynamic. When the price of butter goes up, the value of protein goes down. Figure 2 separates the actual protein prices into the two components of the formula. During 2015, the price of butter has been high, so the contribution to the butterfat part of the milk protein formula has been lower, as can be seen in Figure 2.
The Class III price
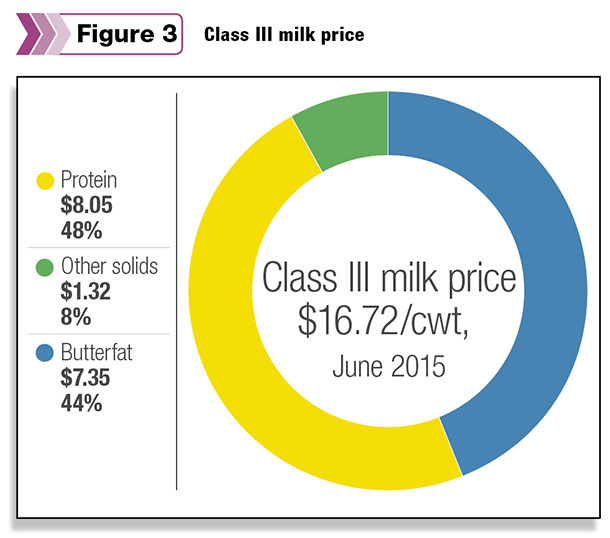
The often-quoted Class III milk price is based on the formulas above with a standardized level of components. Roughly, it assumes a 3.5 percent level of butterfat, a 3 percent* level of protein and a 5.7 percent* level of other solids. (*The exact calculation for protein is 2.9915 percent and “other solids” is 5.6935.
The exact calculation is based on the skim milk formula divided by the level of non-butterfat or 96.5 percent.) See Figure 3 to see how these percentages impacted the Class III milk price in June 2015.
 The Class III milk price is driven almost totally by the price of cheese. By combining and simplifying the formulas above, the standardized Class III price formula is as shown below.
Class III milk price = 9.6 x price of cheese per pound + 0.4 x price of butter per pound + 5.9 x price of dry whey.
The historical correlation of the cheese price and the Class III milk price is 0.96.
Producer price differential
Producers are initially paid on the basis of Class III milk. Not at the standardized component levels, but at the actual component levels. Each order then calculates a “uniform” price based on the pricing of each of the four classes of milk at that order’s weighted average and if the uniform price is higher than the Class III price, a positive producer price differential is calculated and paid. If it were lower, a negative producer price differential would be calculated, reducing the payment to the producer.
The producer price differential can vary significantly among the six orders. As an example, in the upper Midwest, where more than 80 percent of the milk goes to cheese manufacturing, the average uniform milk price would always be near to the Class III price. In the Northeast, where the higher-priced Class I milk is predominant, the uniform price can be well above the Class III price, thereby providing a higher producer price differential.
Somatic cell count
In the four Federal Milk Marketing Orders located in the middle of the U.S., a premium or penalty is paid based on the somatic cell count measured in cells per milliliter. If the count is below 350,000 cells per milliliter, a bonus is paid. However, if the count is above 350,000 cells per milliliter, there is a penalty. The amount of the bonus or penalty is based on the somatic cell count adjustment rate. In turn, the somatic cell count adjustment rate is based on the NASS price of cheese.
Somatic cell count adjustment = Price of cheese per pound x 0.0005
What really drives the producer’s milk revenue?
A producer has little influence on the price paid for his milk components.
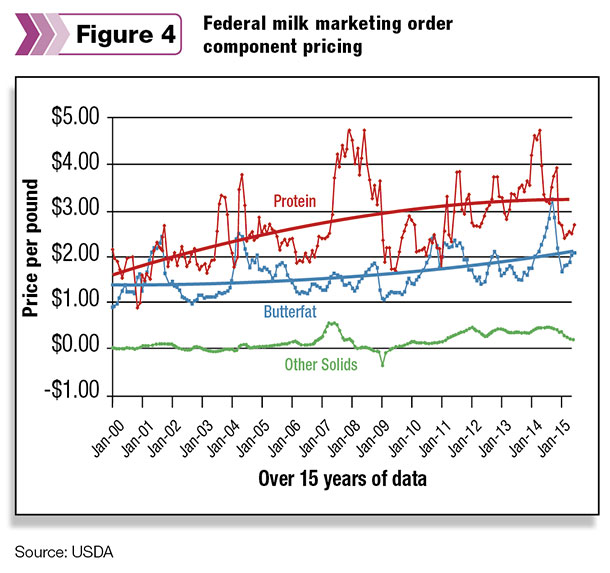
What the producer should focus on is getting more components in the milk (pounds, not percentage), and this will provide more revenue. Milk protein is consistently valued higher than butterfat, and “other solids” are lowest in value. To the extent possible, a producer should work hardest to increase milk protein. However, typically, when protein production goes up, butterfat also goes up.
The producer has little impact over the price paid for his components. The values for these components are dependent on the prices of cheese, butter and dry whey, which in turn are influenced by domestic and international events.
However, a producer can use hedging and forward pricing techniques to help stabilize his revenue. To date, these tools are used much more frequently by dairy processors than dairy producers. To use these financial tools, a thorough understanding of the payment system is needed. PD
Click here to read the first article "Producer milk payment systems in the U.S.
Click here to read the third article "The Federal Milk Market Order's advanced payment system"
Click here to read the fourth article "California vs. FMMO milk pricing"

-
John Geuss
- John Geuss Consulting
- Email John Geuss

