A vast area of the U.S. was stricken with drought throughout the 2012 growing season, dragging forage and grain yields down in its wake. The weather in 2013’s growing season has taken a swing to the opposite end of the spectrum, supplying excessive rain in many areas and creating conditions unsuitable for both planting and harvesting.

Flooding and poor germination have been common this year, adding to more variable crops than you would probably prefer.
Many have already begun to feed this year’s forage simply because of limited 2012 inventories.
Many have also sampled this year’s crop as it is harvested, giving us a sound glimpse into 2013 forage quality.
Now that we’re well into late summer, let’s put 2012 behind us, focus on 2013 forages and take some time to look at what we can expect from this year’s perennial forage crops.
First, I focus on NDF, ash and crude protein (CP) contents, and then look to NDF digestibility (NDFD).
What’s the reason? Higher NDF and ash mean less energy per pound of feed and less milk per pound of TMR.
Higher NDFD, in turn, means more milk per pound of feed, roughly 0.5 pound milk per one-unit increase in NDFD. Are you curious what 2013 feed looks like?
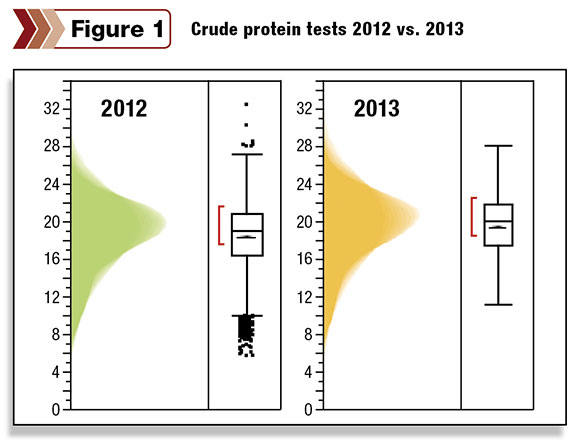
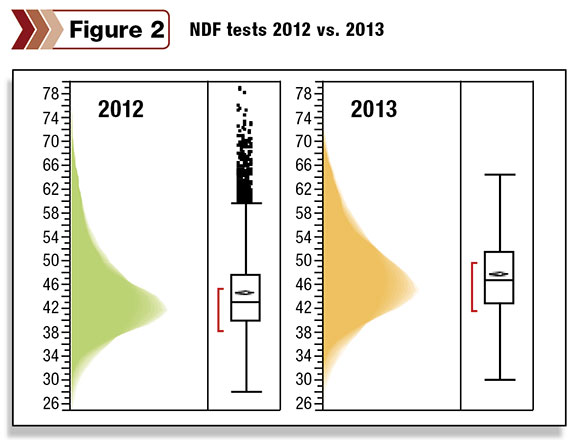
Figures 1 through 4 compare June-July of 2012 and 2013 forage samples in histograms.
These figures show you how forages tested in our lab. For example, in 2012, our samples
were approximately 20 percent CP but ranged from about 5 percent to 28 percent.
Continuing on the CP note, forage results this year are slightly higher, which at first glance suggests higher-quality forage.
However NDF, ash and NDFD are more important to your dairy’s performance than CP content; you should look at these with more attention.
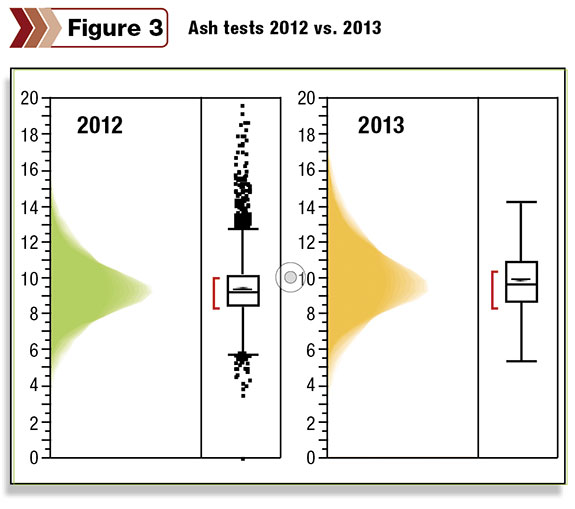
You can see higher NDF (Figure 2) and ash contents (Figure 3) in 2013 relative to 2012, meaning lower quality and causing RFV to drop by 10 to 15 points.
The ash content increase is interesting, and we have subjectively noticed many more
ash-contaminated samples relative to prior years.
I speculate the added ash is due to additional rain splashing soil up onto plants, lower cutting heights in the field (attempting to maximize yield) or flooding in some cases.
Ash presents a challenge for a laboratory to analyze because these samples are contaminated, but more importantly, it’s a challenge for dairy cows that consume, chew and re-chew the forage.
Soil also harbors Clostridia spp. bacteria, yeast and mold micro-organisms.
I also suspect your forages may ferment differently this year given the higher ash values.
Beyond NDF and ash, I focus on NDFD as the next-most-valuable forage quality parameter. Alfalfa and grass NDFD measures have dropped off this year.
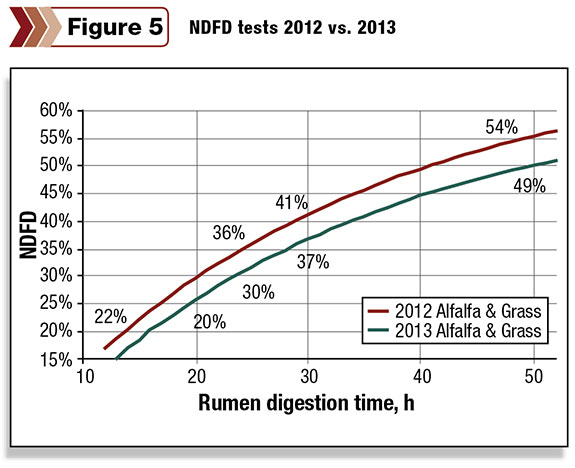
Figure 5 contains rumen NDF digestion curves for 2012 and 2013 forages.
This figure shows how fiber digestion happens in the rumen over time.
This is not the most easily understood topic, but knowing the height and shape of the digestion curve are important factors in determining how much milk you can capture from a ton of forage.
You can see 2012 had both a higher and steeper curve relative to this year, meaning that even if we have the same forage NDF levels in your ration, the cows will not gain the same energy and will drop in milk.
How much impact should we expect on performance?
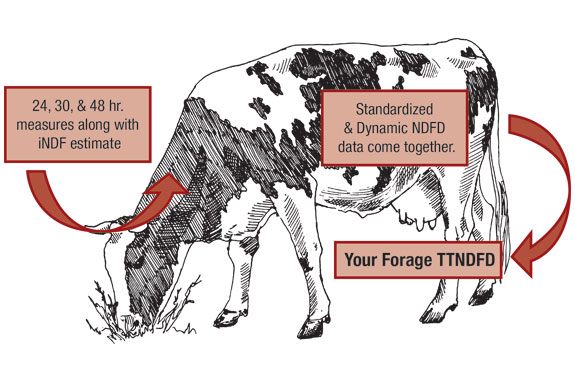
David Combs of the University of Wisconsin Dairy Science Dept. recently developed the Total Tract NDFD forage analysis tool, a tool that better forecasts forage quality impact on milk production.
Combs established Total Tract NDFD to achieve the following:
 • Be a realistic predictor for how much fiber is actually digested by your cows
• Better forecast milk gains or losses when changing forages
• Funnel multiple standardized and dynamic in-vitro rumen NDF digestion measures into a single result
• Measure the height and shape of the rumen NDF digestion curve (e.g., Figure 5)
• Agree with published Total Tract NDFD measures for high cows (which 30-hour or 48-hour in-vitro NDFDs do not)
In practical terms, think of Total Tract NDFD as a relative forage quality measure on steroids.
For 2013, the average Total Tract NDFD value has decreased by nearly 10 percent (from 44.0 percent to 40.5 percent for 2012 and 2013, respectively).
The decline for 2013 means cows will digest 10 percent less fiber this year, which will in turn decrease milk production by about 1 to 3 pounds of milk.
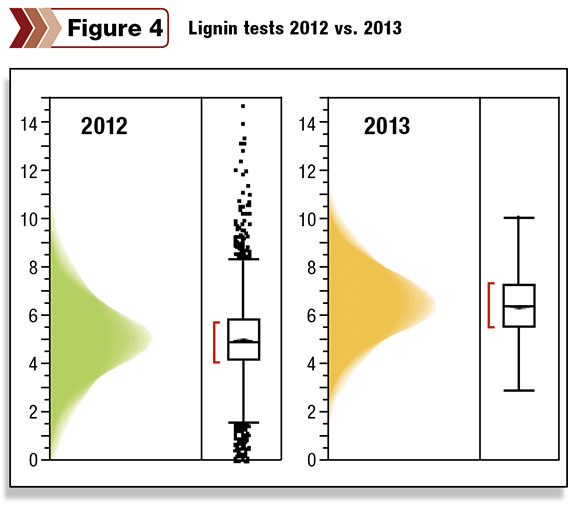
Lignin content, which in the past has been used to forecast quality, has also increased 30 percent this year over last ( Figure 4 ), meaning the forage has more woodiness to it.
Ultimately, your forage quality and ration will determine real gains or losses. Remember, I am focusing on averages here. Keep in mind: Cutting hay based on the calendar does not take into account crop physiological stage.
Crop stage (e.g., vegetative, bud or flower) and stem-to-leaf ratio dictates quality, and this year I’m speculating that the crop grew faster and taller than we anticipated, leading to higher NDF content and lower quality. PD
Goeser earned a Ph.D. in animal nutrition from the University of Wisconsin – Madison and directs animal nutrition, research and innovation efforts at Rock River Lab Inc. based in Watertown, Wisconsin.
References omitted due to space but are available upon request. Click here to email an editor.

John Goeser
Director of Nutrition, Research and Innovation
Rock River Laboratory Inc.