


It is quite likely that as a child you were exposed to a game known as “Musical Chairs.” A room full of children would race around an ever-declining number of chairs assembled back-to-back while a song played in the background.

Every beat of the song kept your mind wondering, “Is now the time?” You would watch the people around you as you measured your distance to the chair, constantly moving forward and continually eyeing the coming seat with a game plan. Then the music stopped. Everyone scrambled for their seat of choice.
However, not everyone was successful in parking themselves on the four-legged safe zone. Someone was left standing – their timing ill-measured, having no luck … and no seat. Game over! What made this game challenging is that you could never pick when the music stopped.
Small hesitations in the very song in play would sometimes cause premature seating. Your plan of attack had to be nimble enough to adjust with each approaching chair. The stress of the environment grew with each chair taken away.
In many respects, marketing milk in this environment is much like playing musical chairs. We have witnessed a phenomenal move higher that has surpassed all that history would define as normal. We are now in the place where we slowly walk forward waiting for the proverbial music to stop.
It has been an enjoyable song. Never before have producers enjoyed consecutive months of January through April pricing north of $20 for the entire period in Class III and Class IV history. However, like all songs, it must come to an end.
The question most have is what track will play next: “Going Down in Flames” or “Give Me One More Shot.” Trying to predict the shuffle order of that playlist creates another challenge for producers, especially when considering the historical response to milk prices at levels north of $20 per cwt.
Let’s take a look at how history has handled these situations previously (see Figure 1 ). An overlay of Class III and Class IV reveals that their collective movement displays a high degree of correlation from one class to the next. More importantly, it reveals quickly the futility of milk in current price ranges.
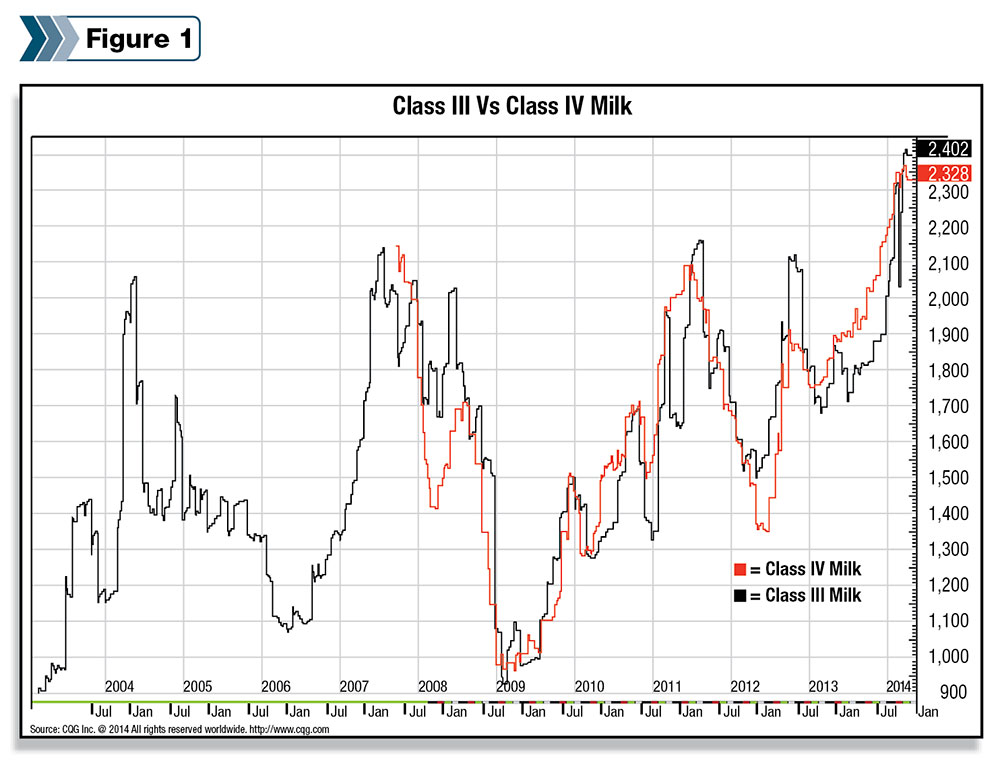
Going back to the export-led 2007 market, prices found a way to stay above $20 for 15 weeks before experiencing the first major setback only to return to the higher ground for a five-week stay. From there, it dropped into the start of 2008 before finding some spring strength to lead it back to the $20-plus territory for five more weeks.
The year of 2009 was a hole that some never came out of. Fleeting export activity coupled with hesitant domestic consumption caused a great deal of retraction in the quantity of product demanded and ultimately the price received by farmers.
The year of 2011 produced similar opportunity as the Class III & IV spent on average 14 weeks above $20, with Class IV showing the greatest longevity above this threshold. At the time of this writing, we are 16 weeks into our stay above $20 and at levels never before seen.
What remains of the year (May through December) is averaging $20.02 in Class III and $17.87 in Class IV. How much longer can we stay here? How much longer can/will the consumer hang on? If history gives any clarity to the future, the song may be almost over. If so, what is our risk?
Given current export activity, the most representative rallies took place in 2007-2008 and 2010-2011 when growing exports and a hungry Chinese economy allowed for movement to price levels north of $20 per cwt. Using these periods as a model, downside risk will be held to levels only a few dollars below where the averages currently reside.
The immediate draw on prices after the highs were established took the price of Class III milk to $17 per cwt in 2008 and $15 per cwt in 2012 before finding enough support to launch its next run. Class IV prices dove a little deeper; support wasn’t found until roughly $14 per cwt in each of those two rallies.
In early 2013, $17.50 has caught the fall of Class IV markets. Class III prices found support near $17 during 2013. In addressing risk, it is plausible to look at short-term risk in the $17 and $17.50 for Class III and IV, respectively. However, a longer-term view suggests deeper risk to $14 and $15 per cwt for Class III and IV as we get into the 2015 calendar. Why?
You must look beyond the prices to the cycles that the prices follow. Many of you have likely read past articles I have authored about the three-year cycle that has defined past decades of milk markets. Some of you may subscribe to it yourself.
Some have shrugged it off as invalid given the lack of absolute response in 2012. However, historic droughts have a way of causing such alterations. Take a close look at that period and you will notice that we were very much on course for a repeat prior to Midwestern rainfall taking a sabbatical.
The year of 2015 would complete the most recent three-year cycle and creates an even deeper risk than what exists in the short run. Sure, there will be a lot of discussion about the new era of export activity and why and how prices should never return to such low levels.
However, that same conversation was prevalent prior to the ruinous and devastating drop in late 2008 and early 2009. Trying to convince yourself of such a result is like playing musical chairs hoping that the overseer of the game put the song on a continuous loop and didn’t take away any seats.
While producers may enjoy the song that is currently playing, it will come to an end. When the music stops, will you have a seat? PD
UPDATE: Since the publication of this article, Mike North has left First Capitol Ag and is now the president of Commodity Risk Management Group. Contact him by email .

Mike North
Sr. Risk Management Adviser
First Capitol Ag


