


Due to my interest and background in purebred dairy cattle, I have followed the price of dairy replacements for many years. While working with a Florida-based dairy cooperative, my interest in watching dairy replacement prices grew for another reason. Many of the cooperative members purchased all or a large percentage of their replacements. Some members purchased hundreds of replacements each year. Watching the replacement buying patterns of cooperative members provided me another barometer of what was happening on their dairy farms in terms of profitability.

When members increased replacement purchases, especially when replacement prices were relatively high, it told me the farms were making money. However, when dairy farmers decreased or stopped their purchases, I knew the reverse was taking place. This was especially true when replacement prices were declining or relatively low. Also, it told me to expect less milk to market in a few months.
Let me share my interest in dairy replacement prices by taking a historical look at average replacement prices in dollars, as well as in terms of pounds of milk and cull cows. The prices used in this article are the national averages published by the USDAâs National Agricultural Statistics Service (NASS).
Granted, just like milk prices, there are regional differences in replacement prices. The regional differences can be seen in the regular Progressive Dairyman Market Watch reports. However, the NASS national average provides us the best statistics to look at price changes over time.
Going back more than 50 years to 1960, we find the average dairy replacement price was $223 per head. As seen in Figure 1 , replacement prices have moved upward since 1960 with a few ups and downs along the way.
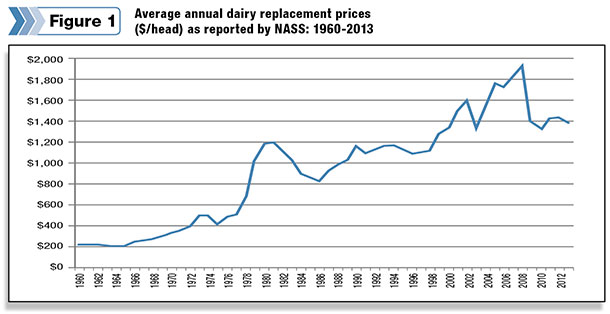
The replacement price peaked at $1,950 in 2008, the year after the record all-milk price in 2007. Replacement prices crashed in 2009, along with the milk price, but have increased slightly since 2010, averaging $1,385 per head in 2013.
Table 1 shows average replacement prices by decade, which helps to understand changes over time better. The average price per head doubled from the 1960s to the 1970s, then doubled again in the 1980s.
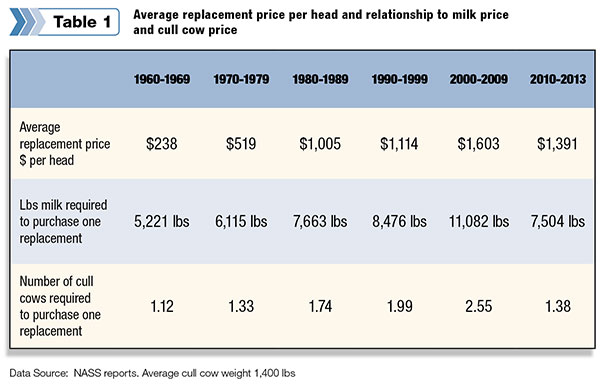
I consider the late â70s and the first part of the â80s some of the more profitable times for dairy farms. At the beginning of the 1980s, the average replacement price was about $1,200 per head, almost four times the replacement price at the beginning of the 1970s.
Increasing replacement prices told me dairy farmers were making money during this time frame. However, by 1985 things changed. Remember dairy price support declines, government warehouses full of dairy products, assessments and the whole-herd buyout?
In 1985, the average replacement price dropped more than $300 per head, from 1980, to $860. Dairy farm profitability diminished and replacement prices responded accordingly.
Most of the 1990s saw little change in replacement prices, just as milk prices were relatively stable, until the last part of the decade. Then things started getting interesting as one century ended and a new one started.
The 21st century began with the average replacement price at $1,340 per head. Then the price moved steadily upward, reaching $1,950 per head in 2008, a 45 percent increase from 2000.
Record milk prices in 2007 and 2008 led to good dairy farm margins, thus driving up the demand and price for replacements. Then when milk prices dropped 30 percent in 2009, the average replacement price fell to $1,390 in 2009.
Since 2009, there was little change in average replacement prices. Last year, 2013, the average was $1,385, almost the same as in 2009. Even with a record-high milk price in 2011, the replacement price did not make a big jump upward, as in 2008. High feed prices and dairy farmers still recovering from the losses of 2009 kept margins tight, thus not bidding up replacement prices.
Milk and cull cow prices
A dollar today has less purchasing value compared to a dollar in previous years. To help provide a more equitable comparison in replacement prices over time, two comparisons are made. The first is the pounds of milk needed to purchase a replacement. The second is the number of cull cows equal in value to a replacement (see Table 1).
The amount of milk required to purchase a replacement more than doubled from the 1960s to the 2000s, as well as the number of cull cows equal to a replacement. Since the first decade of the new century, relationships have changed.
From 2010-2013, it took about 30 percent fewer pounds of milk to purchase a replacement compared to the previous decade. And thanks to higher beef prices, only 1.38 cull cows equaled the average value of a replacement from 2010-2013.
In fact, the ratio was 1.22 in 2013 whereas, from 2000-2009, it took 2.55 cull cows to equal the average replacement price. Even though, in comparison to cull cow price, a dairy replacement costs less today compared to 2000-2009, the replacement price has not increased. Again, this tells me dairy farmers could not economically justify paying higher prices for replacements.
Inventory
An article on dairy replacement prices is not complete without taking a look at the inventory of replacements. Back on Jan. 1, 2000, the supply of dairy replacements was estimated at four million head, as seen in Table 2 .
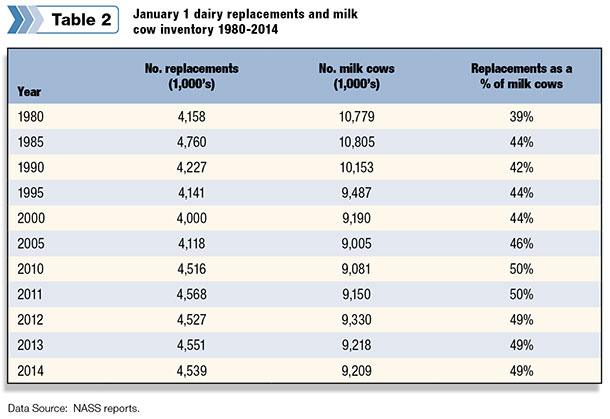
In 2010, the inventory increased about 500,000 head from 10 years earlier, to 4.5 million head. Since then the inventory has remained at slightly more than 4.5 million head. In addition, since 2010 the number of replacements as a percentage of dairy cows has remained between 49 and 50 percent of the number of dairy cows.
No doubt the increased use of sexed semen and improved growing of heifers are major factors in higher inventories during the past few years.
However, the high cost of raising heifers (cost to raise greater than selling price) and higher beef prices (dairy cows bred to beef bulls) may be factors for replacement inventories holding steady from 2010-2014. Time will tell what impact these factors will have on replacement inventories and prices.
In summary, keep a watch on dairy replacement prices. They are a tool that can help us gauge what is happening on dairy farms. The price dairy farmers are willing to pay for a replacement provides a good insight into dairy farm profitability. PD
Calvin Covington is a retired dairy cooperative CEO and now does some farming, consulting, writing and public speaking.

Calvin Covington
Retired Dairy Co-op Executive


