Conscientious feeders want to do the best job possible for both their owners and cows. Their goal, whether written or not, is to manufacture and deliver a high-quality, accurate and consistent ration in an efficient manner. Too often, though, obstacles unnecessarily impede the feeder’s process, quality and/or accuracy – and the ration suffers. This was the case recently when a dairy requested a TMR audit. Its feeders were struggling to deliver a consistent total mixed ration (TMR) to the pens prior to cows returning from the parlor.
TMR audit
As part of the TMR audit process, the feeding center was evaluated and a time study of the mixing process was conducted. The dairy’s recent purchase of an additional wet byproduct, wet brewers grain (WBG), extended their forage inventory. The WBG added two minutes and 50 seconds to the mixing process.
The wet, bulky WBG also created a bottleneck in the feeding center’s traffic pattern. Additional minutes were required per load to maneuver around the pile. The feeders compensated by reducing the mixing time at the end of each load. In addition, daily maintenance and equipment evaluations were done only as time permitted. Mostly, these tasks were neglected.
Because the WBG pile placement made loading the mixer properly difficult, many ingredients were loaded at an angle to the twin-screw mixers. The improper loading and reduced mixing time resulted in inconsistencies in the TMR along the bunk.
Inconsistencies
The inconsistencies were revealed through a particle size evaluation using a Penn State shaker box and confirmed by lab analysis. Ten samples were taken per load of feed along the bunk then shaken out to determine an average percentage for material on the top two screens and the bottom box.
A percentage for the coefficient of variation (CV) was calculated for the second screen and bottom box. The average of the samples did not tell the whole story. The reduction in variation around the averages is the key to providing a consistent ration from the start to the finish of delivery.
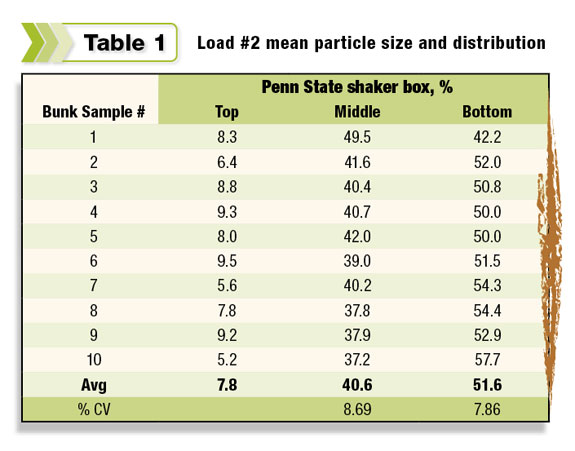
The load in Table 1 shows the results of the shaker box from the 10 samples and the CV for the middle screen and bottom box. Through our audit experiences, a well-mixed ration will have a CV at or less than 3 percent.
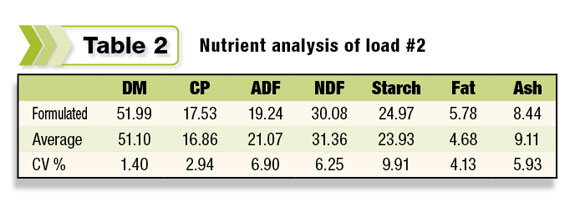
The nutrient analysis of the mix confirmed the variation of the samples. Note the 9.91 percent CV for starch in Table 2 . After the last ingredient was added, the feed was mixed for one minute and 15 seconds prior to delivery. The dairy’s mixing protocol requires five minutes of mixing after adding the last ingredient.
Our team could visually see the inconsistency of
the delivered feed in the bunk. For one of the last loads, we positioned the mixer in a different location to correct ingredient loading, suggested a minor change in ingredient order and had the feed mixed for the required five minutes after adding the last ingredient.
Because of the clumping of alfalfa hay and haylage, we moved haylage to the third
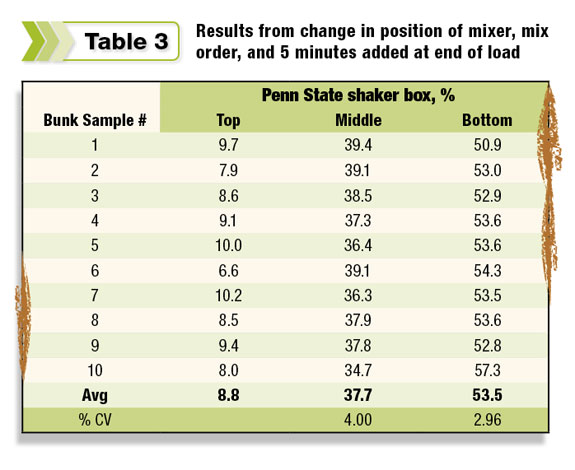
ingredient after the grain mix. The changes resulted in a dramatic improvement in the consistency of the feed and reduction in CV without significantly affecting effective fiber, as seen in Table 3.
Opportunities
After the TMR audit, the team discussed the audit results with the feeders and managers. Although the lab analysis data was not available, the particle size and time study evaluation results supported further changes.
We discussed opportunities to change ingredient storage arrangements and the importance of adhering to feeding protocol. We
noted that the kicker plate and portions of the flighting on the screw were showing signs of wear and needed immediate attention.
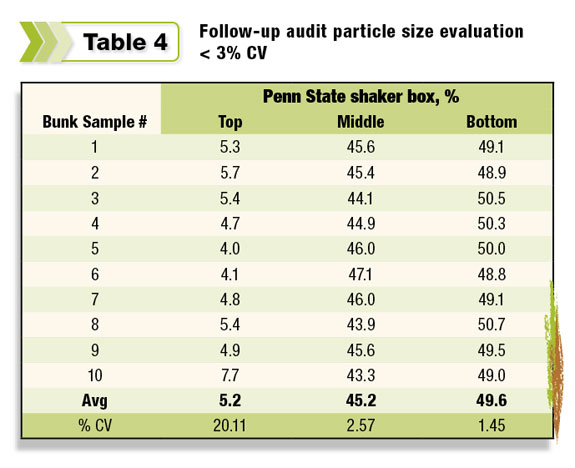
Our recommendations were taken under advisement and a follow-up visit was scheduled. Prior to the follow-up visit, the dairy changed the feed center layout, which reduced total mix time by five minutes. The equipment was repaired and daily maintenance was being attended to. The consistency of the ration improved with the particle size distribution CV reduced to less than 3 percent, as seen in Table 4.
A similar case
In a similar case, a dairyman wanted to improve the efficiency of his feeder. As we observed the feeder in his normal routine, we found time was wasted by getting in and out of the tractor to open and close crossover gates. Opening, driving through and closing the gate required four minutes. With 12 lactating loads, minutes at each gate totaled to hours of lost productivity.
In addition, each stop for a gate caused feed to be unevenly distributed in the bunk. This resulted in time being spent pushing feed up to the bunk later in the day to ensure the feed was available the length of the bunk.
The feeding center’s layout also caused the feeder to repeatedly move between the tractor and loader. We calculated three minutes per load to move between equipment.
To improve feeder efficiency, we worked with the manager. The number of stops to open gates was minimized and fresh feed delivery was synched with the cows’ return from the parlor. At the feed center, the layout was redesigned to reduce the number of equipment changes and moves.
The dairy also began using a super-mix which contained many grain products. Using the super-mix improved the feeder’s accuracy and decreased ingredient deviation.
Altogether, these changes saved two hours of time and simplified the feeder’s day. Now he can concentrate on making a consistent ration and delivering it in a timely fashion.
Many times, little things – like adding a new ingredient or spending time changing crossover gates – cause the largest bottlenecks in efficiency. If you have not recently asked your key employees about obstacles and opportunities to improve their efficiency, this might be a good time to do so. PD
Tegeler is employed by Diamond V as a dairy technical service specialist for the eastern United States.