Thanks to new research, we now have the ability to routinely evaluate the profile of butterfat as an indication of how it’s being made by the cow.

With this new milkfat analysis, we can assess how well the rumen is functioning and also gauge what impact overall management is having on rumen conditions. This can be especially useful when butterfat numbers are less than ideal or when dealing with milkfat depression.
Meet the fatty acid groups
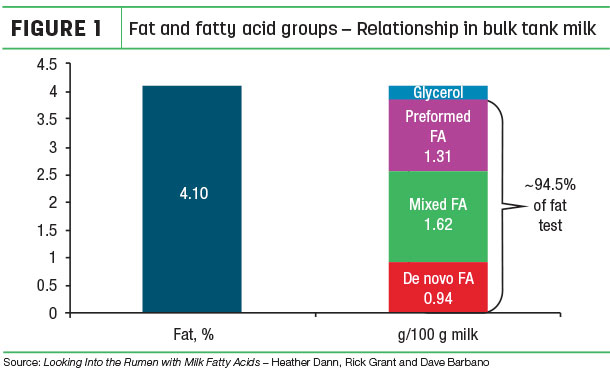
Milkfat analysis essentially breaks down the butterfat number into key groups of milk fatty acids: de novo, preformed and mixed. De novo fatty acids (short-chain) are made in the mammary gland and then secreted in milkfat. Preformed fatty acids (long-chain) come from the diet or are mobilized from body stores.
Mixed fatty acids (medium-chain) can be made in the udder or come from the diet. The milkfat analysis numbers help us understand two effects: how the rumen bacteria are fermenting the carbohydrates that provide volatile fatty acids as precursors to make milkfat and how dietary fats in the ration are handled in the rumen by microbes (Figure 1).
To understand this interaction better, it’s helpful to review how the rumen reacts to fat. The rumen bugs don’t like unsaturated fat in the rumen, so they try to convert them to saturated fat through a process called rumen biohydrogenation. Under normal conditions, this conversion process follows a preferred Yellow Brick Road of sorts.
However, the rumen bugs can take unsaturated fats down a dark path when rumen conditions are altered to produce trans-fat intermediates. As little as 2 to 4 grams of these trans fats can limit the cow’s ability to make de novo (short-chain) fatty acids in the udder – reducing bulk tank butterfat by 0.5 percent.
Get to know your de novo
The researchers at Cornell University and Miner Institute evaluated milk fatty acid profiles of 430 herds during a 15-month period. They found a strong positive relationship between milkfat and protein content and the content of de novo fatty acids in milkfat. Since de novo fatty acids are made by the cow, their concentration in milk gives us an indication of how well the rumen is functioning; did rumen bugs follow the Yellow Brick Road or take the dark path?
Careful evaluation of herds in the trial showed herds with higher levels of de novo fatty acids in milk had common diet characteristics, such as more physically effective fiber. However, they also found these herds had some significant management practices in common.
Higher de novo herds delivered feed more frequently, were 10 times more likely to provide more than 18 inches of bunk space per cow and five times more likely to have less than 110 percent stocking density. Management practices that affect a cow’s dining experience impact the rumen’s ability to function properly and keep rumen bugs focused on the Yellow Brick Road.
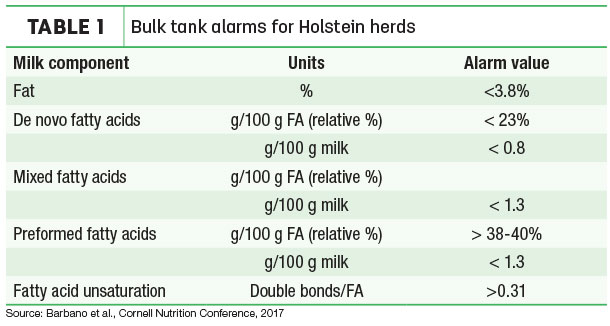
Some milk co-ops and the Dairy Herd Improvement Association labs are beginning to report the milk fatty acid profile by providing the proportion of de novo, preformed and mixed fatty acids. Table 1 shows alarm values for Holstein herds as guidelines for where these numbers should be and to help recognize early warning signs the rumen microbes might be veering off course.
Milking the analysis for actionable metrics
We can leverage the milk fatty acid profile analysis as a helpful management tool. If milkfat percent and de novo fatty acids are both high, we can be confident diet and management are keeping the rumen on the Yellow Brick Road, and all is going well. Oftentimes, we’ll utilize these numbers to troubleshoot a herd that has moderate or low bulk tank milkfat percent.
In many cases, de novo fatty acid content will be low when high levels of unsaturated fatty acids are used in the diet and there are challenges with dining experiences. This combination creates a strange paradox in nature: Feeding too much of the wrong fat to a cow can cause her to produce less fat in her milk.
A different scenario I saw recently was where a herd’s butterfat was a lackluster 3.55 percent, but de novo fatty acids were well above the alarm levels. In this instance, cows responded in milkfat percent to the addition of a protected bypass fat source.
Over four weeks, both mixed and preformed fatty acids increased to above the alarm levels, and overall fat test rose to 3.85 percent.
Finally, the fatty acid profile of milk changes with season of the year and across stages of lactation. These scenarios may lend the opportunity to closely monitor groups of cows for indications of changing energy status and effects of summer heat stress.
Reviewing a detailed milkfat analysis on a routine basis can help give you and your consulting team a more precise understanding of how well your cows are functioning. Are their rumens traveling on the Yellow Brick Road or have they wandered down the dark path and need help finding their way back?
Keeping a herd steadfastly on the Yellow Brick Road is the best way to achieve maximum component efficiency, a dairy’s Emerald City. ![]()
ILLUSTRATION: Illustration by Kristen Phillips.

-
Jay Giesy
- Technical Service Specialist
- Cargill
- Email Jay Giesy