Outside of hay and dairy and/or beef circles, it’s likely a little-known fact that dry hay remains third highest (behind the glamour twins of corn and soybeans) in terms of total value to U.S. crop producers on an annual basis.
The USDA’s annual Crop Values summary, released each February, estimated the 2017 hay crop value at about $16.2 billion.
“Value” is a product of two things: price multiplied by volume. The gross value is calculated using weighted average prices during the marketing year, multiplied by annual harvest estimates. The 2017 estimates are preliminary.
Despite maintaining its lofty rank among U.S. crops, the annual value of the U.S. dry hay crop has been on the decline, especially as it relates to alfalfa.
“While lower prices have been an issue, the biggest contributor to a reduction in overall alfalfa hay value is declining acreage,” said Dan Putnam, University of California – Davis Extension agronomist and forage specialist. It’s a double-edged sword: “Lower prices also suppress acreage,” he said.
2017 prices improved
U.S. average alfalfa hay prices improved to $152 per ton in 2017, up $16 from 2016. Despite the increase, the average was still the second-lowest since 2010. The crop’s total value, estimated at $7.9 billion in 2017, was also the second-lowest this decade.
Both average price and total value remain well below peaks in 2011-14, when alfalfa hay averaged between $196 and $211 per ton and total values regularly surpassed $10.5 billion. The value of 2017’s crop was down about 28 percent from 2011.
Sixty years ago, in 1957, the U.S. area devoted to alfalfa/alfalfa mixture hay topped 30 million acres. Within three decades, in the late 1980s, alfalfa/alfalfa mixture hay dropped 5 million acres, to about 25 million acres, and then fell another 5 million acres by 2010. By 2017, alfalfa/alfalfa mixture acreage was down nearly 14 million acres from 1957, a decline of 46 percent.
Historically, acreage devoted to alfalfa/alfalfa mixtures in California had been remarkably steady, topping 1.1 million acres for several decades. However, it last topped 1 million acres in 2009 and has fallen sharply in recent years, dipping below 900,000 acres in 2011, below 800,000 acres in 2015 and all the way to 660,000 acres in 2017.
Drought has been a major factor for declining acreage in California, as hay competes for water with crops growing on trees and vines. Almonds surpassed alfalfa as the state’s leading crop (in terms of acreage) about four years ago, Putnam said.
Labor is also a factor. Instead of “slugging away” at eight hay harvests a year, a grower can plant trees, install automated irrigation systems, and contract pest management and harvesting.
Increasing exports – in terms of both hay and dairy products, a byproduct of feeding forages to cows – may provide some incentive for boosting hay acreage, especially in the West, Putnam said. However, it’s not likely to return production to bygone days.
“Those who remain in the hay business may benefit for a higher relative demand for their product in spite of lower acreage,” Putnam said.
Another factor leading to a decline in the overall value of the dry hay crop is the form forages are being utilized, said Dan Undersander, University of Wisconsin Extension agronomist. In Wisconsin, for example, haylage and dry hay production are about equal, with haylage carrying a higher value, Undersander said. Baleage production is also on the rise.
The USDA’s calculations for dry hay value do not include haylage or baleage. The agency does calculate an “all forage” value, converting haylage and greenchop values on a dry matter basis. The USDA estimate the 2017 all-forage value of about $18.25 billion, up from last year, but $4 billion less than the peak in 2013.
”Dairy areas generally fill bunkers and tubes first, and then bale the rest,” Undersander said.
Finally, with corn silage yields increasing faster than alfalfa yields, dairy producers are making the switch to that feed source.
New technologies – including low-lignin traits – may add to alfalfa’s competitiveness, Undersander said.
Other hay
Beyond alfalfa, the value of the 2017 U.S. “other hay” crop was estimated at $8.3 billion, surpassing the value of alfalfa hay for a second consecutive year. The U.S. average price for other hay showed a very small improvement in 2017, up just $1 from 2016, to $119 per ton.
Despite increased acreage, drought-impacted yields were down, reducing total value: Like alfalfa hay, it was the second-lowest average since 2010.
Looking head to 2018
How much “value” will the 2018 hay crop provide? Here are some factors as the first quarter of the year comes to a close.
-
Acreage competition: As the old saying goes, they’re not making more farmland. USDA releases its Prospective Plantings report on March 29, so we’ll get some idea of how hay acreage stacks up against other crops. We already know acreage newly seeded to alfalfa in 2017 was the lowest since the USDA started releasing estimates two decades ago.
Winter weather concerns in the Upper Midwest are raising red flags regarding potential alfalfa winterkill, creating the potential of reseeding or putting those acres to another crop.
Some analysts predict recent changes to the federal cotton program could boost 2018 cotton acreage by 1 million acres over 2017, crowding out some hay ground in Southern states.
Southern Hemisphere weather concerns have been pushing corn and soybean prices higher this winter, adding financial incentives to devote more acreage to those crops. The USDA is also forecasting more wheat acreage in 2018.
-
Drought area shrinks, for now: The USDA’s World Agricultural Outlook Board estimated 25 percent of U.S. hay-producing acreage was located in areas experiencing drought as of Feb. 27 (Figure 1).
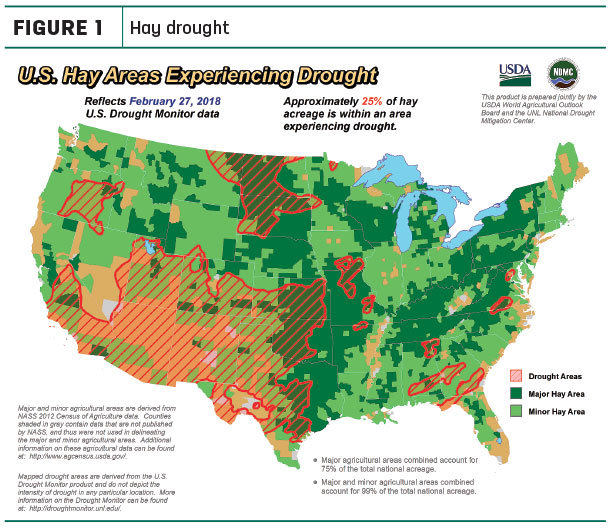 That’s a substantial improvement from a month earlier, when about 40 percent of U.S. hay-producing acreage was considered in drought areas. However, about 31 percent of alfalfa hay acreage remained under drought conditions of Feb. 27, just 1 percent less than a month earlier (Figure 2).
 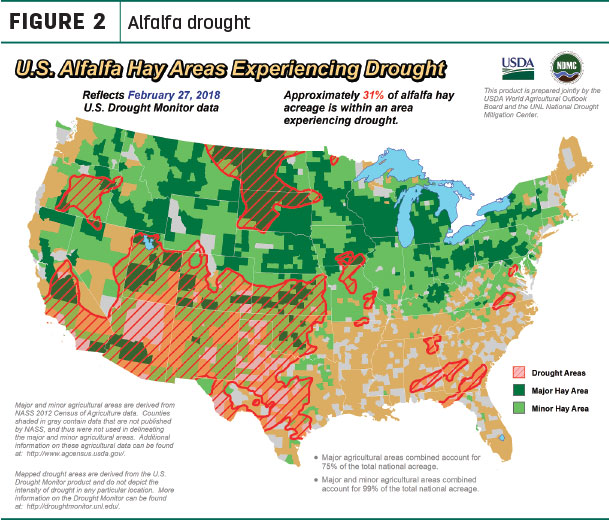 Check out the hay areas under drought conditions.
-
Exports appear strong, but … : January 2018 hay export numbers were not available at Progressive Forage’s enewsletter deadline, but 2017’s strong finish for alfalfa hay was expected to carry over into this year. On the other hand, exports of other hay faced headwinds due to competition from Canada. A new concern is the recently announced import tariffs on steel and aluminum. China is a major source of those imports and also a prominent buyer of U.S. alfalfa hay. In trade wars, agricultural products are frequently a first retaliatory strike.
-
Dairy outlook: In January, U.S. dairy producers were greeted by the narrowest milk income over feed cost margins since July 2016. Low milk prices and squeezed margins were expected to last through at least the first half of 2018. Nonetheless, milk production and cow numbers rose to start the year. With a 5,000-head increase from December, there were more cows in U.S. herds in January than in any month in 2017. But, more dairy cows went to slaughter in January than in any month in the past five years, too.
-
Beef outlook: The USDA’s latest forecast said a large portion of the U.S. cattle inventory is in areas experiencing drought. As a result, more cattle were placed in feedlots during the fourth quarter of 2017. In a typical graze-out period, more cattle would be placed on feed late in the first quarter and marketed in the second half of the year. The timing and weight of placements in the coming months will increasingly depend on precipitation in the Southern Plains.
- Fuel prices: The U.S. Energy Information Administration (EIA) estimated U.S. retail prices for regular gasoline ended February down a penny from the previous week, to $2.55 per gallon, but remained 23 cents per gallon higher than a year ago. The U.S. average diesel fuel price dropped 2 cents to $3.01 per gallon, but were 43 cents higher than a year ago. A strengthening global economy could push prices higher as energy demand grows, but increases in U.S. oil production are currently keeping pace.
Hay prices
The latest available USDA monthly ag prices report was released Feb. 27, summarizing January 2018 prices.
Alfalfa
The January 2018 U.S. average price paid to alfalfa hay producers at the farm level was $152 per ton, equaling seven-month highs of July and October 2017, but $26 more than a year earlier.
Regional averages changed little from a month earlier, with the exception of the Southwest, where dry conditions were the most extensive (Figure 3).
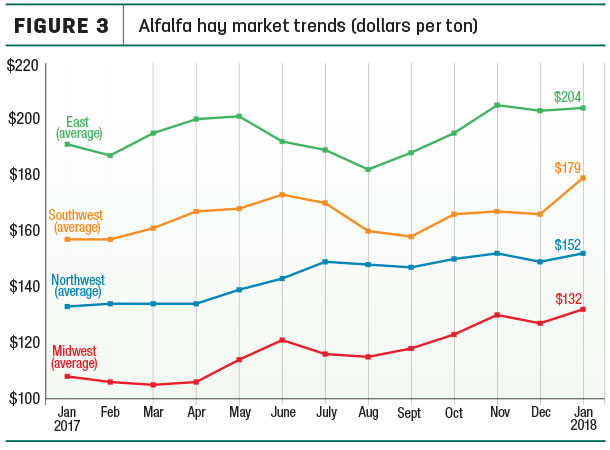 Compared to a month earlier, January average alfalfa hay prices were up $10 to $20 per ton in Arizona, California, Nevada, Oklahoma and Texas, as well as in North Dakota and South Dakota.
Price changes from a year earlier were more dramatic. January 2018 prices for alfalfa hay were up $40 or more in California, Kansas, Nevada, New York, South Dakota and Wisconsin, and $20 to $30 higher in Arizona, Colorado, Iowa, Michigan, Minnesota, Nebraska, Ohio, Texas, Utah, Washington and Wyoming. Only Illinois, Kentucky, Missouri, Oklahoma and Pennsylvania reported alfalfa prices down from a year ago.
Highest alfalfa hay prices were in New York ($238 per ton) and Kentucky ($210 per ton); lowest prices were in Nebraska ($102 per ton) and North Dakota ($108 per ton).
Other hay
The January 2018 U.S. average price for other hay was estimated at $124 per ton, up $6 from both December and January 2017.
Regional averages were slightly higher everywhere but the Southwest, which was unchanged (Figure 4).
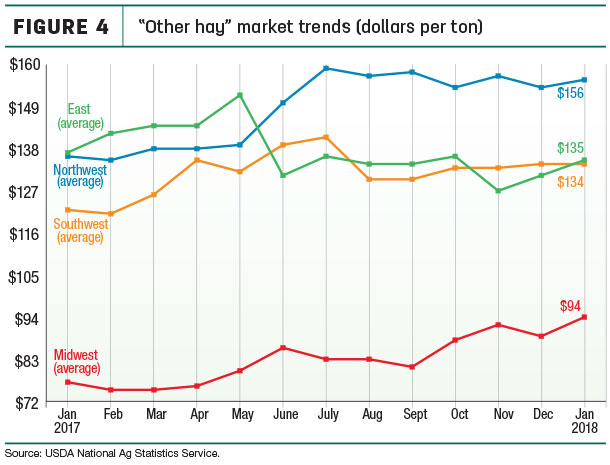 Washington saw the largest jump from December, up $30 per ton, with Iowa up $19. Only Montana, Nevada, Oregon and Texas saw lower prices for other hay compared to a month earlier.
As with alfalfa hay, individual state price changes from a year earlier were more notable. January 2018 prices for other hay were up $65 per ton in Washington, and $35 and $36 per ton in Arizona and Wisconsin, respectively. In contrast, New York saw an $18 drop in the year-to-year average other hay price, and the price in Oklahoma was down $12 per ton.
Highest other hay prices were in Washington ($220 per ton) and Arizona ($190 per ton); lowest prices were in Oklahoma ($72 per ton) and Nebraska ($77 per ton).
Figures and charts
The prices and information in Figure 3 (alfalfa hay market trends) and Figure 4 (“other hay” market trends) are provided by NASS and reflect general price trends and movements. Hay quality, however, was not provided in the NASS reports. For purposes of this report, states that provided data to NASS were divided into the following regions:
- Southwest – Arizona, California, Nevada, New Mexico, Oklahoma, Texas
- East – Kentucky, New York, Ohio, Pennsylvania
- Northwest – Colorado, Idaho, Montana, Oregon, Utah, Washington, Wyoming
- Midwest – Illinois, Iowa, Kansas, Michigan, Minnesota, Missouri, Nebraska, North Dakota, South Dakota, Wisconsin
Organic hay
The USDA organic hay report found few sales. According to the Feb. 28 report, Premium alfalfa small square bales averaged $250 per ton (grower FOB farm gate prices). No prices were reported for delivered hay.
My summary
Export numbers are down quite a bit in January 2018:
- January alfalfa hay shipments of 170,430 metric tons (MT) were the lowest monthly volume in 25 months, dating back to December 2015. China’s total of 71,306 MT was down substantially, while sales to Japan, Saudi Arabia and South Korea were also weaker.
- Sales of other hay totaled 103,023 MT in January, the lowest total since December 2008. Sales to Japan were on par with December 2017, but South Korean purchases were down.


-
Dave Natzke
- Editor
- Progressive Dairyman
- Email Dave Natzke

