


Federal Milk Marketing Orders (FMMOs) were created in the mid-1930s to bring order to milk marketed in the U.S. At the time, milk was primarily consumed in fluid form, which is classified in FMMOs as Class I for pricing purposes. As recently as 1960, 65.4% of all milk priced through FMMOs was classified as Class I milk. This proportion has now dropped to less than 28% and represents only about 20% of all the milk produced in this country.

Many changes and adjustments have been made through the years on how prices for the different classes of milk are calculated. One such change, which at the time appeared to be minor and inconsequential to dairy producers, was implemented in May 2019. It simply changed how the skim milk price fraction of Class I milk is calculated.
Pricing Class I skim milk
Basically, there are two ways one can calculate skim milk price from market prices of dairy commodities.
- Class IV approach. Class IV prices are calculated from market prices of butter and nonfat dry milk. In the Class IV formulas used by the USDA, butter prices are translated to Class IV butterfat prices using a straightforward formula. Likewise, nonfat dry milk prices are translated to nonfat solids using the following formula:
Nonfat solids price (dollars per pound) = [Nonfat dry milk price (dollars per pound) - $0.1678] x 0.99
In this formula, the “$0.1678” is the make-allowance to manufacturers – basically how much (on an average) the USDA assumes it costs to manufacture a pound of nonfat dry milk; the “0.99” term simply accounts for the moisture (1%) left in nonfat dry milk once it is dried. Knowing that skim milk contains 9% nonfat solids, the Class IV skim milk price is then simply calculated as:
Class IV skim milk price (dollars per cwt) = Nonfat solids price (dollars per pound) x 9.0
Class I milk is forward-priced. That is, the average market prices of dairy products during the first two weeks of the preceding month are used to calculate Class I prices during a given month. For example, December Class I prices were based on butter and nonfat dry milk wholesale prices during the weeks ending Nov. 7 and 14. During those two weeks, nonfat dry milk was priced at $1.0891 per pound, which translated to an advance Class IV skim milk price of $8.21 per hundredweight (cwt).
-
Class III approach. Class III prices are calculated from market prices of butter, block and barrel cheeses, and dry whey. Butter price is used to calculate Class III butterfat price using the same formula as the one used for calculating Class IV butterfat price. Whey price is used to calculate the price of other (milk) solids, also in a very straightforward formula. Lastly, the weighted average of block and barrel cheddar cheese prices are used in a more complicated formula to determine the price of (true) milk protein.
The complexity in this formula comes simply because cheese contains other things than protein (i.e., butterfat and water) that must be accounted for. The details of these formulas are not important here. Skim milk contains three things: protein, other solids (OS) and water. Water carries no value in Class III calculations. It is assumed that skim milk contains 3.1 pounds of protein and 5.9 pounds of other solids (hence the 9 pounds of nonfat solids per hundredweight of skim milk). Therefore, the price of skim milk calculated using Class III prices is simply:
Class III skim milk price (dollars per cwt) = [Protein price (dollars per pound) x 3.1] + [OS (dollars per pound) x 5.9]
During the weeks ending Nov. 7 and 14, protein price stood at $6.131 per pound, while OS price was pegged at 18.1 cents per pound. Therefore, the advance Class III skim milk price for December was calculated to be $20.07 per cwt.
In short, using the Class IV approach, Class I skim milk would be priced at $8.21 per cwt but, using the Class III approach, Class I skim milk would be priced at $20.07 per cwt. Clearly, these two numbers are very different. So which one should be used?
-
The “old” formula. Until May 2019, Class I skim milk was priced using the higher of the advance Class III skim milk price (i.e., $20.07 per cwt in December 2020) and advance Class IV skim milk price (i.e., $8.21 per cwt). The larger number from the two approaches was always the winner. This worked well for dairy producers but not so well for Class I handlers (the bottlers). The issue was not so much the resulting price but the fact that the “higher of” determination made hedging a challenge to handlers, as they had to not only bet future dairy commodity prices, but also guess which of the two skim milk approaches would “win” during a month in the future.
- The “new” formula. To address this issue, it was suggested to use the simple average of the two approaches. Clearly, using a simple average of the two prices would be detrimental to dairy producers. So a compromise was made: Advance Class I skim milk price would be calculated as the average of the advance Class III skim milk price and advance Class IV skim milk price with 74 cents per cwt added to this average. Apparently, the 74 cents per cwt came simply from the average difference ($1.48 per cwt) between the advance Class III and advance Class IV skim milk prices during the prior three years. Thus, on an average, dairy producers should not lose anything from using the new formula. But reality does not always follow prior averages.
Pricing outcomes between May 2019 and December 2020
“Forecasting” the past is always easy. In this instance, all we had to do was to retrieve a price series for the advance Class III skim prices and the advance Class IV skim milk prices to calculate what the base Class I skim price would have been under the old formula and to compare this number to the actual base Class I skim price calculated under the new formula. Those results are presented in Table 1.
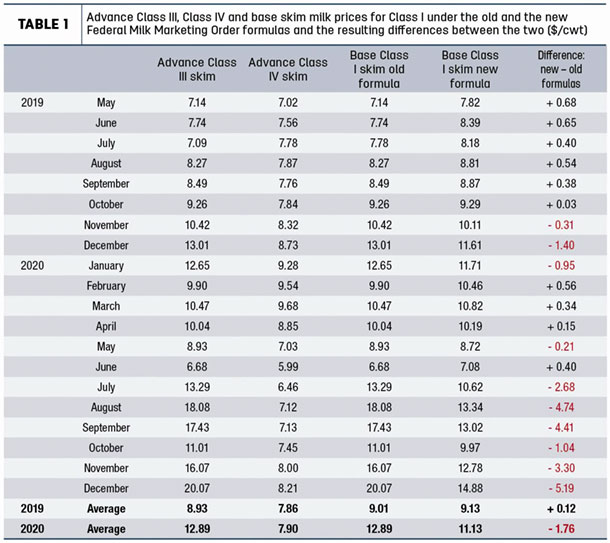
I need to point out that the base Class I skim price is the same across all FMMOs. What changes across FMMOs is the Class I differential added to this base price. Therefore, the difference between the old and the new formula would be the same for all skim used in Class I regardless of where the milk was processed. Over the 20 months spanning from May 2019 to December 2020, the difference between the new formula and the old formula ranged between -$5.19 per cwt to +68 cents per cwt of skim.
This spread of outcomes underlines the fundamental flaw in thinking that adding 74 cents per cwt to the average of the two prices was a fair deal to both producers and Class I handlers. Using simple high school algebra, one can easily show that the most producers could gain from using the new formula is 74 cents per cwt of skim, and this would occur only when the advance Class III skim price is equal to the advance Class IV skim price. Anytime these two prices are different, producers gain less than 74 cents per cwt of skim. In mathematical jargon, the gains are bounded upward at 74 cents per cwt. But how much can producers lose from the new formula? Well, looking at the results reported in Table 1, producers can definitely lose up to $5.19 per cwt of skim.
Still using the same high school algebra, one can easily prove that producer losses are unbounded. Given the right (and screwy) conditions, losses could be $10 per cwt, even infinity (albeit not likely … ). So although producers were the winners in 10 out of the 20 months since the implementation of the new formula (i.e., exactly half the time), when they won the gains were small, averaging 41 cents per cwt of skim, but when they lost, the losses were considerably greater, averaging $2.42 per cwt of skim.
In eight out of the 10 months where producers lost from the new formula, the resulting losses exceeded 74 cents per cwt, which is the maximum they could ever gain. Statistically, this means the distribution of outcomes is skewed, not normal (i.e., not Gaussian). This has considerable importance when gauging the relative risk incurred by producers and Class I handlers from the formula change.
To illustrate how this type of risk is not your usual type of risk, consider this example. Insurance companies charge you a premium for insuring your car. You pay for small damages (the deductible) while they pay for the big losses. In exchange for removing this risk from your shoulders, the premium you are being charged is more than the expected (i.e., average) losses they will have to pay out. This is in line with a fundamental law in economics which loosely states that risk has to be rewarded. On an average, stocks have a higher return than bonds because they are riskier. If not, any coherent investor would stay away from stocks. In the formula change put in place by the USDA in May 2019, producers were taking a much greater risk from the formula change than were handlers, yet they were not compensated for taking this greater risk.
What do I foresee happening forward? Forecasting the future is much harder than forecasting the past. We know that producers lost 22 cents per cwt in January, 31 cents per cwt in February and will lose 48 cents per cwt in March on all skim milk used in Class I. That’s not a good start and equates to a projected additional $150 million loss for 2021. Based on the current CME Class III and Class IV futures, producers are projected to keep losing and losing for quite some time … all the way to December 2021.
National impact on producer milk revenues
Currently, there are 11 FMMOs in the U.S. I extracted the data for each of those 11 orders and calculated the losses per cwt of milk marketed through FMMOs for all of 2020. Results are presented in Table 2.
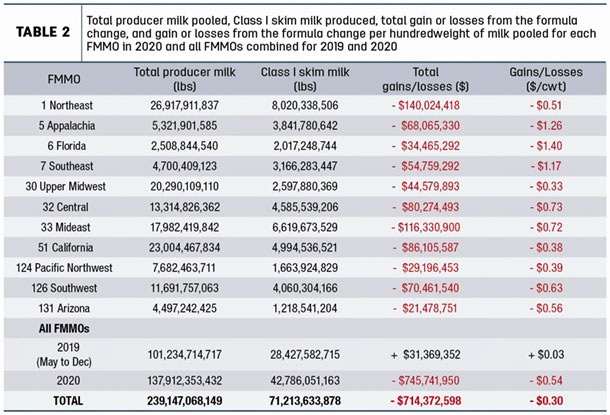
In Table 2, gains or losses from the formula change were first calculated in each month for each FMMO using the amount of Class I skim milk reported in each FMMO and the formula differences reported in Table 1. Total gains/losses in each order were then the simple sums in each order over the 20 months since the formula change was implemented.
The Northeast, Mideast and California orders suffered the largest cumulative losses simply because they are the largest users of skim in Class I milk. Put simply, a lot of people live in these orders. The “Gains/Losses” column reports what a producer has lost on his or her milk check on an average over those 20 months. It is calculated as the ratio of total gains/losses over the total producer milk, the latter being the total of all milk pooled in a given order.
To a producer, the gains/losses only occurred on the fraction of the milk in his or her order that went to Class I skim. Therefore, producers shipping milk in an order where a large proportion of the pooled milk was used in Class I had a disproportionately greater loss of milk revenues per hundredweight of milk shipped than those producers in a low Class I utilization. Hence, the loss per hundredweight of milk shipped was the largest in the Florida order at $1.40 per cwt and the lowest in the Upper Midwest at 33 cents per cwt.
For 2019, the change to the pricing formula had very little net impact on milk revenues by dairy producers. This was already evident from the data in Table 1. But for 2020, the total losses incurred nationally by dairy producers from the formula change amounted to $745 million, or roughly 54 cents per cwt of milk pooled across all FMMOs. In an industry where the average net income is typically in the $1- to $1.50-per-cwt range, a loss of 54 cents per cwt is no small peanuts.
Cumulatively, producers have suffered a loss of $714 million. If from here on the new formula would always produce a gain equal to the average gains that occurred in the 10 winning months since May 2019 (i.e., 40 cents per cwt), it would take producers 50 months to recover the $714 million in lost income. This is about as likely a scenario as the Cleveland Browns winning a Super Bowl.
The future
Sometimes a small change can have disproportionate consequences. The small change to the Class I skim milk pricing formula was initially thought to be benign, but it wasn’t. Dairy producers bore significantly more risk in the formula change than what Class I handlers did. The first year after the change to the pricing formula was made, it looked like it would have little effect on dairy producers’ income. Eventually it did … and in a big way. It is very unlikely producers will ever recover these losses.
I hear there are discussions in Congress to fix this Class I pricing issue. The fundamental problem is: The pricing scheme used in FMMOs sort of assumes that milk prices would normally drop going from Class I to Class IV, with Class III and Class IV prices being relatively close to each other as they both represent milk being transformed into “storable” products (cheese, butter, nonfat dry milk). That’s how it was when FMMOs were put in place nearly 100 years ago.
The reality is: There is now a significant price dissociation between Class III and Class IV because of processing specialization, regionalization of the production, sizes of these two classes on a national basis, very different susceptibility of domestic prices to prevailing world prices (i.e., we still do not export a large proportion of our cheese production but do export the majority of nonfat dry milk/skim milk powders being co-produced with butter) and government interventions that have not been the same in these two milk classes.


