


December 2019-20 recap at a glance
Reviewing the USDA preliminary estimates for December 2020 compared to December 2019:
- U.S. milk production: 18.94 billion pounds, up 3.1%
- U.S. cow numbers: 9.443 million, up 100,000 head
- U.S. average milk per cow per month: 2,006 pounds, up 40 pounds
- 24-state milk production: 18.09 billion pounds, up 3.2%
- 24-state cow numbers: 8.923 million, up 107,000 head
- 24-state average milk per cow per month: 2,027 pounds, up 40 pounds
Source: USDA Milk Production report, Jan. 25, 2021
November cow numbers raised
Not only were December cow numbers up by 12,000 head from November in the 24 major dairy states, but the USDA added another 12,000 head to November’s previous preliminary estimate, putting the total increase at 37,000 head between October-December. Since bottoming out in June, cow numbers in the 24 major dairy states increased by 96,000 head in the last six months of the year.
Nationally, USDA’s December preliminary estimate retroactively raised cow numbers all the way back to July, boosting November’s total by 24,000 head. That puts the total increase in U.S. cow numbers at 38,000 head between October and December. Since bottoming out in June, cow numbers increased by 93,000 head in the last six months of 2020.
For history buffs, U.S. cow numbers averaged more than 9.5 million head for all of 1994-95, falling below 9.4 million head in the early months of 1996. Since then, U.S. cow numbers hit 9.4 million head again only one year, for about six months in 2017.
Compared to a year earlier (Table 1), December cow numbers were reported higher in 13 states and lower in 8 states, with Georgia, New York and Virginia unchanged. Cow numbers were up a combined 97,000 head in Texas, Indiana, South Dakota, Colorado, Michigan and Idaho, far offsetting the 28,000-head drop in all declining states. California, Florida and Pennsylvania showed the biggest drop, down 5,000 head from the year before.
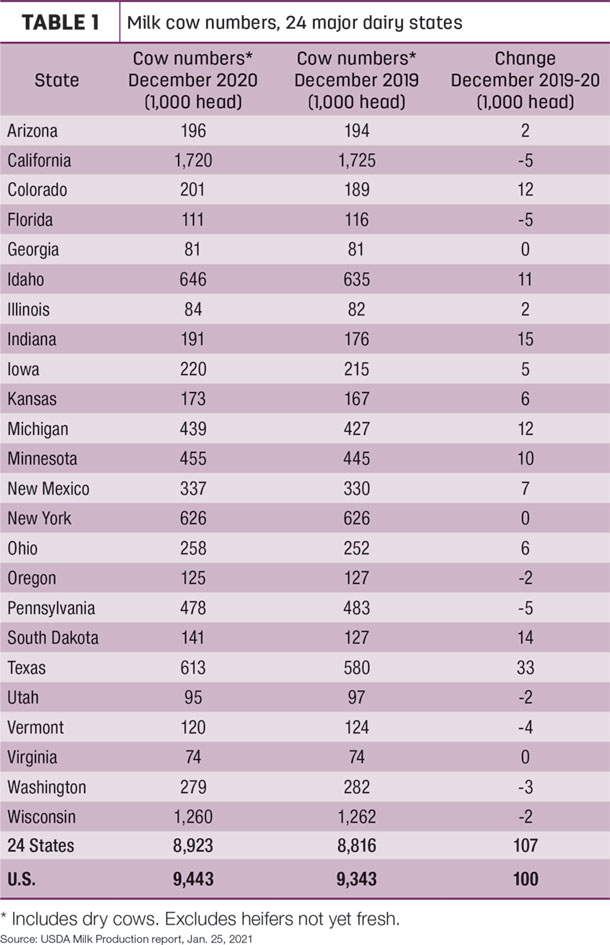
A slower rate in cow culling accounted for some of the growth in the milking herd in 2020. The USDA reported total cull dairy cow slaughter under federal inspection was 3.063 million head in 2020, about 161,000 head fewer than the year before.
Milk per cow grows
December 2020 growth in U.S. and major dairy state average milk output per cow rose about 1.3 pounds per day per compared to a year ago (Table 2). California boosted daily output by about 2.25 pounds per day to lead all states. Only Arizona, Georgia and Idaho reported lower year-over-year output per cow.
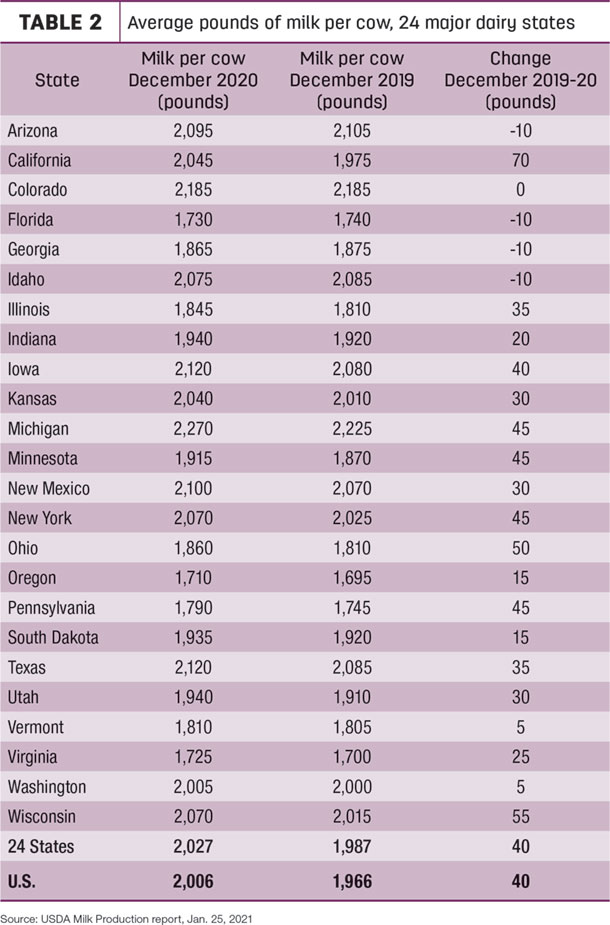
Michigan remained the nation’s leader in milk per cow, averaging 2,270 pounds in December 2020.
Volume, percentage growth
California led the 18 states with year-over-year milk volume growth in December, up 110 million pounds (3.2%), while Texas and Wisconsin were up 91 million pounds and 65 million pounds, respectively.
On a percentage basis, growth in South Dakota continued at a double-digit pace in December, up nearly 12% compared with a year earlier. Indiana output was up about 10%. Florida (-5%) and Vermont (-3%) led decliners. ![]()
-
Dave Natzke
- Editor
- Progressive Dairy
- Email Dave Natzke


