


Basis shrink continued for a fourth straight year in the Upper Midwest No. 30 Federal Milk Marketing Order (FMMO), according to Mark Linzmeier, owner of MarginSmart, a dairy financial and marketing information company headquartered in Green Bay, Wisconsin. However, during 2018, higher component levels for milk within FMMO 30 tempered the overall basis reduction and, in many cases, dairy producers realized their highest basis levels since 2014.
For this purpose, basis is the difference between an announced price and the price received by the dairy farmer. Historically, the Upper Midwest order has been one of the most competitive for milk, and basis in the region has been one of the strongest.
During 2018 milk processing capacity remained stretched, international trade wars raged on, and the milk supply-demand balance continued out of whack, pressuring basis lower.
Where deductions to basis are being made on producer milk payments are not always clear. Differences in individual dairy farm basis generally are related to plant premiums, hauling charges, deductions and other payment factors. Basis also can differ between farms based on items controlled by the dairy farms themselves, most notably individual component percentages and somatic cell counts (SCC).
To help producers calculate their basis and unravel sometimes-nontransparent milk checks, Linzmeier launched the fee-based Smart Milk Basis program in late 2017. During 2018, easy-to-read charts and graphs breaking down the milk check statement were added.
A number of key performance indicators – including energy-corrected and as-is milk production per cow per day, actual component percentages, total components per cow per day and SCC levels – compare each dairy to the peer group and the rest of the FMMO. The program displays per-hundredweight (cwt) and absolute dollar differences for key portions of each dairy farm’s basis against the peer group, the FMMO and all processing plants represented by farms within the peer group. Producers who ship to private and cooperatively owned plants are included in the analysis.
Using the Smart Milk Basis program, Linzmeier has created a peer group involving dairy herds and milk processors in the Upper Midwest FMMO. Those herds represent nearly 65,000 cows and averaged about 2,200 cows per herd but range in size from 400 cows to 5,000 cows.
To date, Linzmeier has analyzed milk basis data between 2014 through October 2018. Information incorporated into the analysis includes component percentages, payment per pound of various components by the farm’s milk plant, FMMO-announced producer price differentials (PPDs) and actual PPDs paid by plants, other market adjustments and premiums, SCC levels, as well as hauling charges, checkoffs and other assessments applied against the farm’s net milk price.
Linzmeier has attempted to take some of the “noise” out of the calculations by removing factors outside the control of the processor. Those include differences in actual component percentages, SCCs, changes in FMMO PPDs and the impact of milk contract gains and losses and others. His goal is to come up with a reasonable comparison between dairy plants for dairy herds with equal component percentages and SCC, and help dairy managers understand where these differences occur.
Overall decline
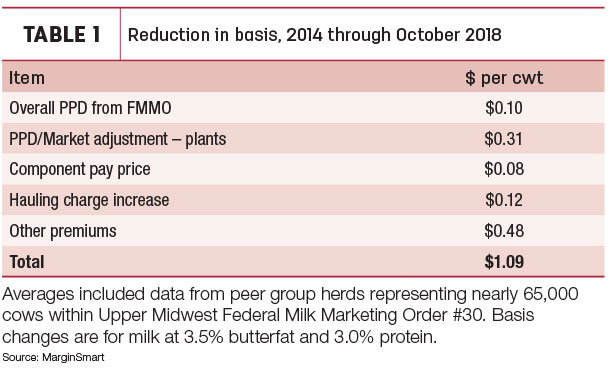
Comparing milk of 3.5 percent butterfat and 3 percent protein and including hauling deductions, Linzmeier’s peer group has seen milk basis shrink a cumulative average of $1.09 per cwt for the period of January 2014 through October 2018 Table 1.
By year, basis dropped an average of 36 cents per cwt in 2015, 23 cents in 2016, 24 cents in 2017 and 26 cents per cwt through the first 10 months of 2018.
Analyzing individual milk checks, Linzmeier worked to determine where basis was being lost. Over the 2014 to October 2018 period, peer group herds (selling milk to both co-op and private plants) have seen:
- Actual PPDs (including co-op-named “market adjustments” and related items) paid compared to FMMO-announced PPDs shrunk an average of 31 cents per cwt.
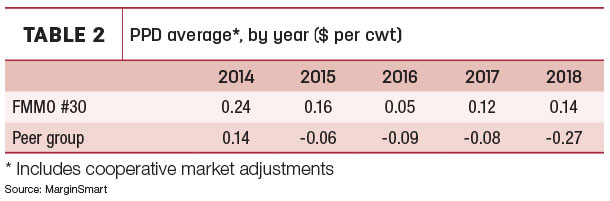
Linzmeier said the FMMO- announced PPD in 2014 averaged +24 cents per cwt (Table 2); through the first 10 months of 2018, the announced PPD averaged +14 cents, so 10 cents of the four-year $1.09 decline in basis can be attributed to differences in the announced PPD.
Excluding that FMMO 10-cent change in PPD leaves 99 cents per cwt under the control of individual plants.
With the PPD adjustment, the cumulative basis decline among all co-op and private plants ranged from 58 cents per cwt to $1.34 per cwt over the full period.
Most PPD reduction has occurred on the co-op side, with some producer-members seeing up to a 75-cent per cwt “disintegration” in the PPD over the entire period. In general, private plants paid the full PPD, although there were some individual instances where PPD was reduced.
- Component prices, especially “other solids.” Another area where deductions were evident included plants not paying the full FMMO price for components. Infrequently, minor deductions were made to monthly reported FMMO protein and butterfat prices. The overwhelming majority of deductions were made in “other solids” prices. While mostly among co-ops, some private plants were also underpaying on other solids.
Looking at his peer group, by year, underpaying for other solids averaged 1 cent in 2014, 5 cents in 2015, 7 cents in 2016 and topped out at 15 cents in 2017 before retreating to 9 cents in 2018 (year-to-date).
Some individual producers saw markedly higher deductions. Linzmeier reported one co-op member saw an other-solids deduction impact on the overall pay price of almost $1 per cwt in selected months.
“That’s a significant difference,” he said. “People don’t think of ‘other solids’ contributing much to the overall price, but when you calculate it out, it can make a huge difference. Our MarginSmart analysis had highlighted this to its customers back in 2016 and 2017 as this was happening, and several pushed back to their co-ops on this area.”
-
Hauling increases. Starting in 2017 and continuing into 2018, many plants have opted to simply increase hauling rates to dairy producers. “Our peer group realized basically even hauling charges for 2014-2016, but for year-to-date 2018, the group is now 12 cents per cwt higher than 2014,” he said.
- Premium adjustments. There have been some differences in how co-op and private plants have reduced basis to cut milk pay prices overall. While co-ops are generally taking basis away through PPD reductions and underpaying on other solids, there also has been some adjustments to premiums. Private plants have resorted more heavily on reductions in volume and quality premiums.
Under the Capper-Volstead Act and federal order rules, cooperatives are not bound to pay the minimum blend price. The exemption recognizes members share in the co-op’s profits and losses, and there are times when a co-op has financial obligations related to plant expansion or construction, balancing costs or times of the year when a plant is losing money.
Component surge
Linzmeier has noticed a credible increase in components for both his peer group and the overall FMMO. He attributes the major reason for this to be the cessation of recombinant bovine somatotropin (rbST) use over the past two to three years.
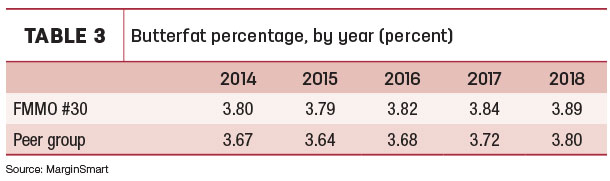
The average butterfat percentage for the whole FMMO has increased each of the past three years and is up 0.09 percent from 2014 to October 2018. The dairies in the peer group (which he said were likely higher users of rbST) have increased 0.13 percent over the same time period (Table 3).
Linzmeier said he believes when higher butterfat average months of November and December are added, the 2014-2018 butterfat increase will grow to nearly 0.2 percent.
While protein percentage levels for both the FMMO and the peer group have virtually stayed equal each year, other solids percentages have increased in the peer group by 0.06 percent.
The combination of the higher butterfat percentage and other solids had led to an increase in basis of 50 to 60 cents per cwt, which has virtually offset the declines in other factors affecting basis over the past two years, Linzmeier said.
When an individual dairy looks at the basis in total, they may not see quite the drops mentioned earlier because they have made some of that back via concentrating on producing more solids. Linzmeier noted actual as-is milk production for the peer group is down over the past 2 years. Per-cow production year-to-date 2018 is virtually equal to per-cow production in 2014.
What’s ahead?
Given the current milk market outlook, basis pressures may continue over the next 12 months. Within the Upper Midwest FMMO, Linzmeier said he isn’t seeing much competition for milk and doesn’t expect that to change unless something big happens related to supply. Some plants built capacity but filled it much quicker than anticipated.
As the calendar turns to 2019, his list of other factors affecting price and basis will include: the status of tariffs and the U.S. ability to regain international market share, credit decisions by lenders (both in terms of reduced expansion projects and basic working capital loans), emphasis by dairy producers to produce components and the impact of the Dairy Revenue Protection program and the 2018 Farm Bill.
Linzmeier said he believes it is critical for the dairy industry to prevail over plant-based alternatives in its defense of the term “milk” in marketing efforts, now under consideration by the FDA. And regardless of that outcome, the industry will need to continue to evolve with new products.
“With all this in mind, I won’t be surprised to see basis decrease by another 10 to 20 cents in FMMO 30,” he said. “However, I do believe that most, or all, of that may be made up with higher overall component percentages.
“The biggest thing is: The industry needs to get supply and demand more in line,” Linzmeier said. “The international market limitations are also playing a major role in prices as well. There are many potential ‘tipping points’ that could create some increased pricing opportunities. If the international markets do not open back up, and we still see increased production of 1 percent or higher of actual components (not as-is production), I am not optimistic for 2019 price recovery. If the international markets open back up, or we see less than 1 percent increase in actual components. I think we could see some recovery – and if both happen, we could see some real nice recovery.” ![]()

-
Dave Natzke
- Editor
- Progressive Dairyman
- Email Dave Natzke


