The optimal dry period length remains a topic of practical interest and scientific study. Short dry period lengths reduce milk, fat and protein yield in the next lactation but allow for more milk harvested in the current lactation.

Many experimental studies have been conducted with a conventional dry period length of about 60 days, a short dry period length of about 30 days and sometimes also omit the dry period all together. In such studies, cows are assigned one of just a few different dry period lengths. However, every cow has her own optimal dry period length that maximizes her expected profitability over multiple lactations and is measured in days.
The optimal time to dry a cow off is not easily determined. To help dairy farmers with dry-off decisions, we need to predict how much milk, fat and protein the cow will make in the next lactation when the dry period is varied.
In a study that was published in the Journal of Dairy Science in January 2021 (“Piecewise modeling of the associations between dry period length and milk, fat, and protein yield changes in the subsequent lactation”), our objective was to develop predictive models of 305-day mature equivalent milk, fat and protein yields in the next lactation as continuous functions of the number of days dry (DD) in the current lactation. In this retrospective cohort study with field data, we obtained DHIA milk recording lactation records with the last DD in 2014 or 2015. Cows included had DD from 21 to 100 days. After editing, 1,030,141 records from cows in 7,044 herds remained. The average dry period lengths in these data were 55, 58 and 58 days for lactations one, two and three respectively.
Three parity groups of adjacent (current, next) lactations were constructed. We conducted all analyses by parity group and yield component. We first applied control models to pre-adjust the yields in the subsequent lactation for potentially confounding effects. Control models included the covariates mature equivalent yield, days open, somatic cell score at 180 days pregnant, daily yield at 180 days pregnant and a herd-season random effect, all observed in the current lactation. Days dry was not included. Secondly, we modeled residuals from control models with smooth piecewise regression models consisting of a simple linear, quadratic and another simple linear equation depending on DD (Figures 1 to 3). Yield deviations were calculated as differences from predicted mature equivalent yield at 50 DD. Control models reduced the average root mean squared prediction error by approximately 21%.
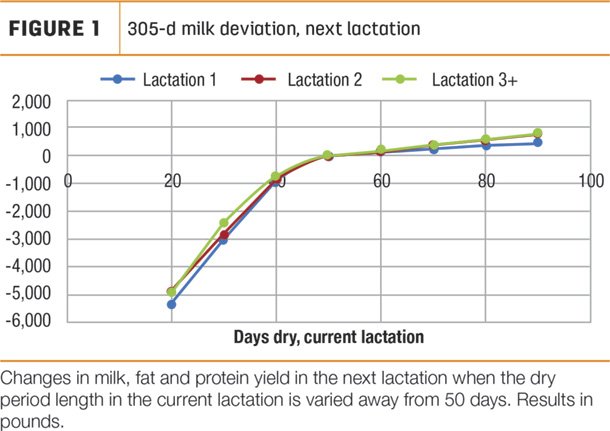
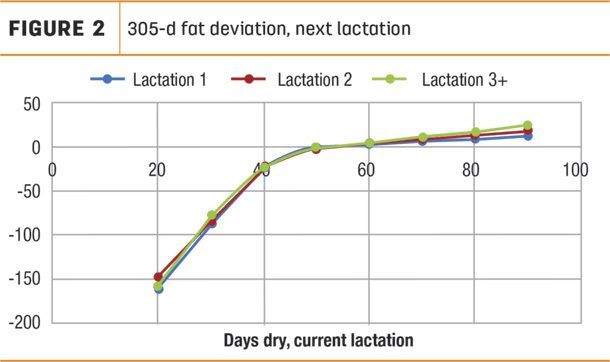
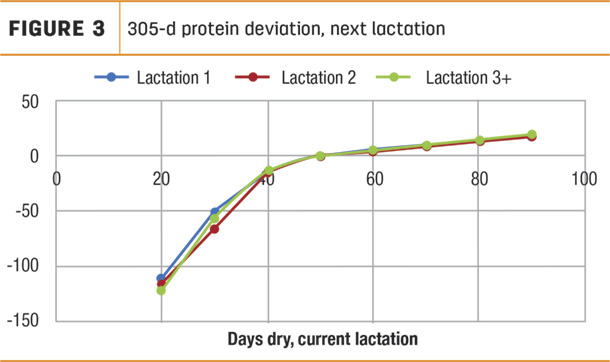
Yield deviations were increasingly more negative for DD shorter than 50 days, indicating lower yields in the next lactation (Figures 1 to 3). For dry period lengths shorter than 50 days, the decrease in 305-day mature equivalent milk yield ranged from 95 to 117 pounds per DD. For mature equivalent fat and protein yields, decreases were between 2.82 to 3.77 pounds per DD and 2.34 to 3.31 pounds per DD, respectively.
Yield deviations often were marginally positive and increasing for dry period lengths greater than 50 days so that the highest yield in the subsequent lactation was predicted for 100 DD. For dry period lengths longer than 50 days, the 305-day mature equivalent milk yield increased at most 9.21 pounds per DD. Patterns in deviations for fat and protein yield were similar to those for milk yield deviations. Predictions from piecewise models and local regressions of published experimental studies were very similar, which supports the chosen functional form of the piecewise models.
We concluded that piecewise models of mature equivalent milk, fat and protein yield deviations as continuous functions of DD fit the observed data well and may be useful for decision support on the optimal dry period length for individual cows. Click here to download a spreadsheet with the piecewise functions and Figures 1 to 3.
—Excerpts from University of Florida Dairy Update newsletter, Winter 2021