


On-farm research is a great way for farmers to discover if a management change will benefit yield, increase the quality of a crop, reduce the environmental footprint, enhance soil health, or have other benefits. In on-farm research, farmers conduct experiments in their own fields, using their soil conditions, farming practices, and resources. This creates a real-world, practical condition and can be initiated by a farmer, scientist, industry, or any combination. Additional benefits are obtained when more farms conduct the same type of research and findings are shared for peer-to-peer learning. When shared with researchers, this can lead to larger datasets that may allow for extrapolation of findings across multiple farms, regions, years or growing seasons, and the development of statewide guidance that can advance practices and policy.
RESEARCH APPROACHES
Conventionally, most on-farm research has been carried out using a randomized complete block design (RCBD) approach, using either smaller plots and field-length strips (strip trials). In this approach, typically the control or business-as-usual is compared to a change in management treatment in alternating strips, and these strips are replicated three to four times (or more where feasible). A single yield value is collected from each strip using truck or farm scales to determine the yield per strip. The results are then compared using analysis of variance (ANOVA) to show if there was a statistical difference between the management change (treatment) and business-as-usual (control) strips. This method of conducting on-farm research is scientifically valid but has limited statistical power. Further, it also presents challenges to farmers and researchers as it takes up space in the field and can be logistically demanding to implement and harvest. This has discouraged farmers from participating in on-farm research. Can we do better?
TECHNOLOGY ADVANCEMENT
As precision agriculture has rapidly advanced over the past decade, more tools have become available enabling farmers to conduct on-farm research much easier. Among the most popularly adopted by farmers is yield monitoring technology, which allows generation of yield maps as crops are harvested. Such yield information, when properly cleaned post-harvest, can then be used to evaluate experiments without the slowdown and coordination challenges that often come with weighing harvest trucks/wagons. But, there is more!
With accurate yield data, a farmer can now obtain yield-based zone maps that show where yield is consistently high or low, and variable or stable across growing seasons. Yield-stability-based management zone maps are practical, and the maps are easy to understand since the concept is based on a key factor of interest: yield. It recognizes that yield varies from year to year, and zones are farm-specific. For each farm, there will always be areas in fields that yield below and above average. Specifically, in non-irrigated agriculture, there are also stable yield areas and areas where weather greatly impacts yield over time.
Yield stability zone maps can be derived for fields with three or more years of yield monitor data (FIGURE 1A).
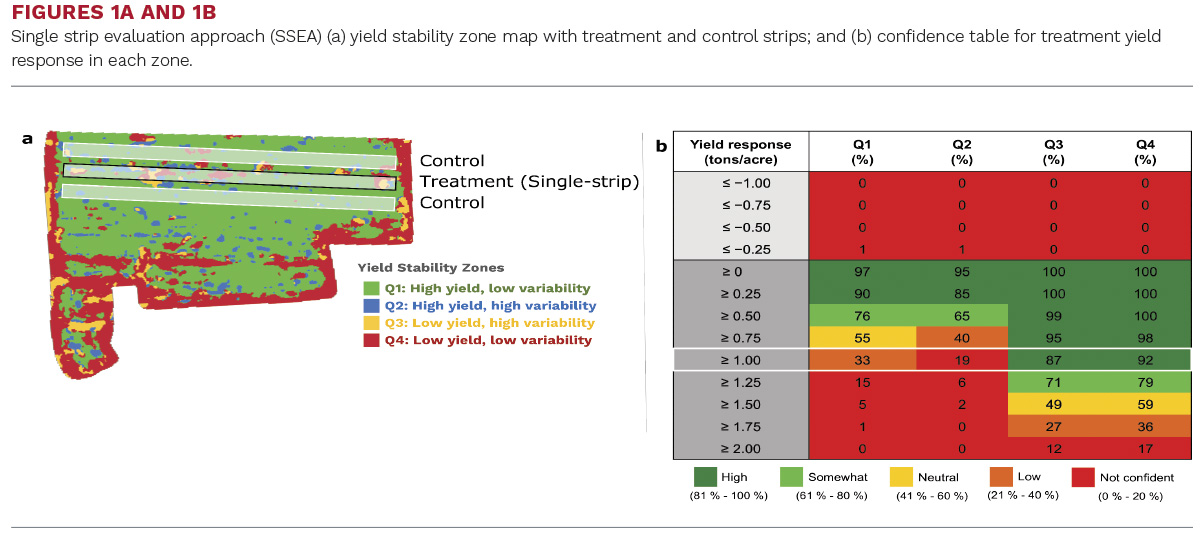
Farmers who participate in the statewide corn yield project conducted by Cornell University’s Nutrient Management Spear Program (NMSP), obtain maps where areas in fields are classified as one of four zones: Q1 are areas that are consistently yielding higher than the farm’s average yield; Q2 also has a higher yield than the average but is variable across years; Q3 are areas that are variable and low-yielding; and Q4 is consistently low-yielding areas (NMSP Factsheet #123). When plotted on a map (FIGURE 1A), zones are denoted as green (Q1), blue (Q2), yellow (Q3), and red (Q4). In this approach, the crop itself becomes a “bioindicator” of productivity.
So, we can generate zone maps but how to manage these zones?
SINGLE-STRIP ANALYSIS
Using high-resolution spatial yield data (typically collected at one-second intervals) from yield monitor sensors, variability caused by soil, climate, and other environmental factors is captured and questions about zone-based management can be answered. Do I need to fertilizer areas in Q1 more or less than in Q4? Should I change population density according to zones? Is sulfur limiting productivity in any of our zones? What could be limiting production in Q4?
Here again, technology comes in place. With advanced spatial statistics, we can now combine information about zones with yield data for the current year and conduct on-farm research using a single-strip treatment design (NMSP Factsheet #124). In this new approach, a management alternative is applied in a strip that goes across the field while the rest of the field is considered business-as-usual or control (FIGURE 1A). A single-strip approach is much more accessible in terms of space and time to implement than the RCBD design. With the single-strip approach, any two-treatment research question (with versus without, high versus low, late versus early, etc.) can be evaluated. A spatial model known as the single-strip spatial evaluation approach (SSEA) was developed to determine our confidence that the management alternative benefited yield. The SSEA results are presented as a confidence table, which represents the level of confidence in the estimated average yield response in each of the zones where the strip was placed. For example, the highlighted section in the confidence chart (FIGURE 1B) shows that we are highly confident in a minimum yield increase of one ton/acre from the management alternative for Q4 (92 percent) and Q3 (87 percent), but have low confidence for Q1 (33 percent), and no confidence for Q2 (19 percent) that year. Such single-strip trials can be implemented in multiple fields and combined across fields, as well as years, to draw conclusions for farm management changes.
A farmer can select where to place the strip within a field or across multiple fields if the research provides answers for zones of interest (Q1, Q2, Q3, and/or Q4). Longer strips are preferred as greater length means more datapoints to compare. The strip width should be two to four chopper or combine widths, but is also partially determined by the width of equipment used (manure spreader, side dress N boom, etc.). To the left and the right of the treatment strip are control or business-as-usual. Therefore, care should be taken that adequate space is allocated and that control strips are not near the field edge. Multiple strips can be placed in a field, provided there is enough space for control strips between treatment strips.
IN THE FUTURE
Not all farmers have access to harvesters equipped with yield monitor sensors and equipment can break during harvest. In addition, yield data cleaning remains a tedious process, but if not done properly, both zone maps and single-trial results can be incorrect.
Much work is ongoing to evaluate remotely-sensed data obtained with drones and satellites for their use to accurately estimate yield and generate yield stability zones. The sensors capture spectral signature (color and infrared bands) used to calculate vegetation indices that help understand plant health and crop growth status. The remotely-sensed data, combined with weather and soil information, is being explored for their ability to accurately estimate yield. While drones cover a smaller area, satellites can cover a large area in a short time. Satellites are not created equal, as they have different spatial and time scales. Also, satellite data is highly dependent on cloud coverage, which can restrict data quality. However, over the last 10 years, the revisit time for satellites has greatly improved. This also opens up a window to explore if single-strip analysis can be done remotely, in the hopes that on-farm research using single-strip approach becomes accessible to all farmers and not just those with access to yield monitor systems.
| This article appeared in PRO-DAIRY's The Manager in March 2023. To learn more about Cornell CALS PRO-DAIRY, visit PRO-DAIRY. |


