Precision feeding is not a new concept. However, with increases in the technology and information available, the ability to achieve new levels of precision feeding is growing. I’ve listened to several webinars and podcasts discussing ration-balancing models over the past year. While listening, I am fascinated with the amount of information these new and updated models can take in to produce an estimate of potential milk and component yields. These models aim to improve the precision of the output estimate, but it makes me wonder how the precision of each input impacts the result.

The concept of ensuring precise feed inputs can seem a little daunting. Where do we start when we know feeds can be quite variable, and how do we adequately capture that variation? Stepping away from cow feed for just a moment, think about a popular snack food. If I asked how many pretzels Chex uses in their original Chex Mix, how would you go about finding the answer? You may go buy a bag of Chex Mix and count the number of pretzels. Is this the true number of pretzels in every bag of Chex Mix? Probably not, as there is likely some variability in mixing. To overcome this, we would go buy more bags and count pretzels until we feel we have an accurate representation of the population.
The same approach could be taken to help understand the percentage of crude protein (CP) in our soybean meal or starch in our corn grain. For many producers, if you ask how much crude protein is in their soybean meal, they will likely consult a feed table or feed library to answer. That would be equivalent to calling General Mills to see what proportion of pretzels should be in each bag, which is hypothetically correct. However, we know that there are likely sources of variation, leading to slightly different amounts in each bag. Similarly, our crops are subject to inherent variation, and byproducts are also subject to variability from processing before becoming feed.
Producers and nutritionists sample forages on a regular basis, with common practices ranging from sampling forages once every week to once every month. However, as new goals of precision feeding are set, these may no longer be adequate practices for accurately defining ration components. Multiple researchers have found that for large dairies, sampling forages two to three times per week can reduce the risks associated with unaccounted feed changes and increase energy-corrected milk and income over feed cost due to more precisely supplying the nutrients in the formulated ration. It is not common for farms to sample their commodities. Granted, the standard deviation in nutrients of commodities is often lower than that of forages, but there is still substantial variability in these feeds.
Standard deviation (SD) is one key measure often used to account for the variability of a parameter. It helps determine how wide the distribution of a population is around a mean. Sixty-eight percent of the population is represented by one standard deviation above and below the mean. Figure 1 illustrates this concept. When we apply the expected variation commonly observed in commodities to our formulated rations, it suddenly feels less acceptable.
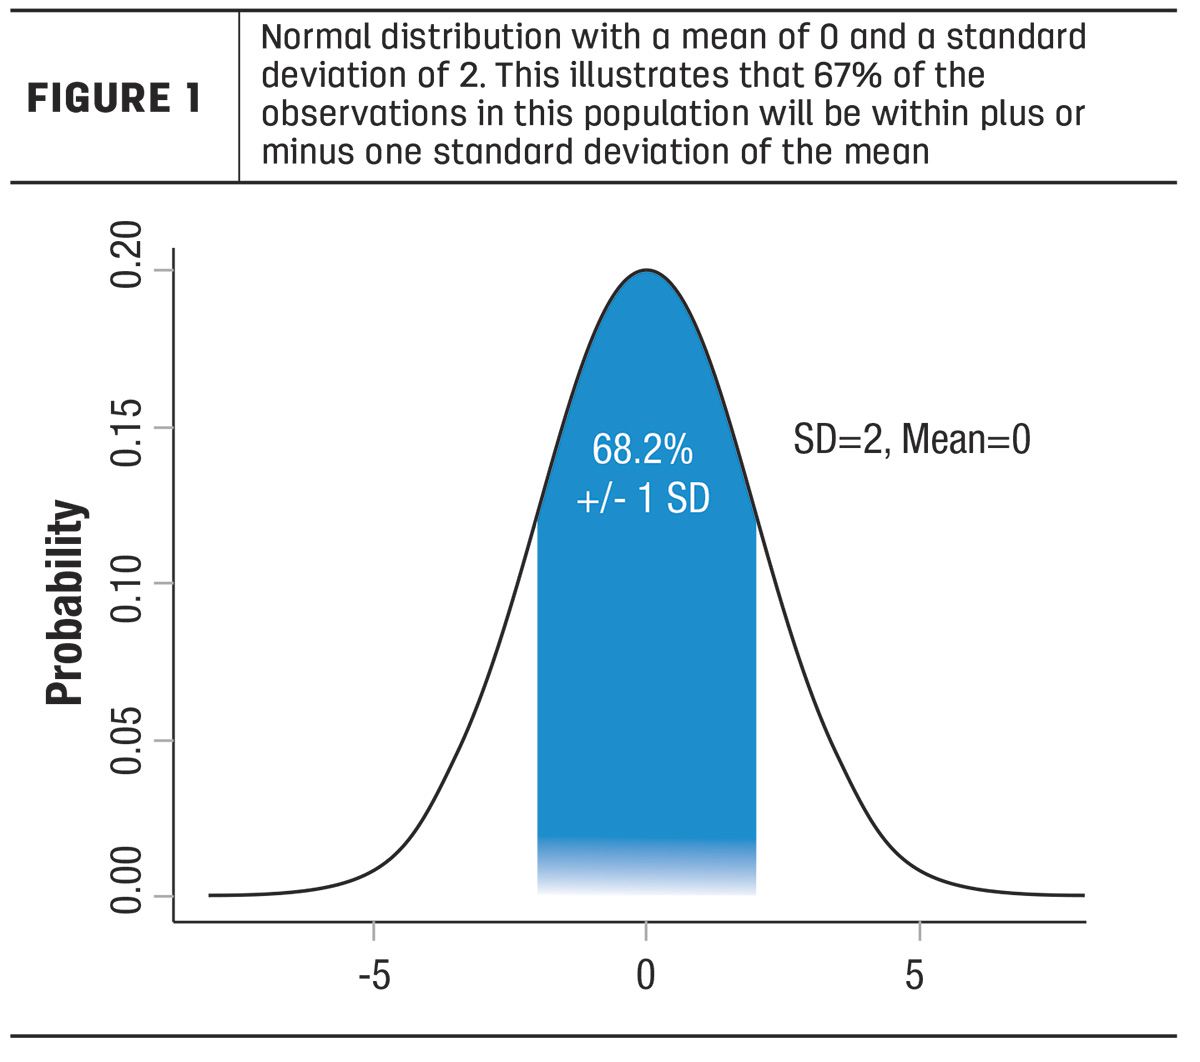
Table 1 shows the standard deviation for dry matter (DM) and key nutrients in common concentrates in 2022, as analyzed at our laboratory. This table also shows the grams per pound of feed associated with one standard deviation over or under the average for each of these parameters. Although these standard deviation numbers may seem small on paper, as we think about feeding multiple pounds of each of these ingredients, the grams supplied above and below the formulated value can be sizable.

For example, when we apply these numbers in a ration formulated to supply:
- 16.5% crude protein
- 55 pounds intake
- Feeding 4 pounds DM of soybean meal
Sixty-seven percent of the time, the ration would be above or below the target by 0.35% crude protein or about 0.2 pounds of crude protein.
That is only considering the variability of one nutrient, but all nutrients we feed are subject to variability. Sometimes these increases and decreases in DM and nutrients may offset each other. But other times, they may compound. In these cases, the ultimate results could lead to much different crude protein than expected. Simply feeding for the average of a feed over a large period of time, especially when our models are calculating grams of nutrients delivered, may no longer be sufficient.
So how do we generate more-precise estimates of the nutrients in our feed? Farms have used many strategies to minimize the impact of this inherent variation in feeds – such as not feeding too much of any one feed or choosing feeds we perceive to be less variable. However, even when taking these steps, it is critical to understand and manage true sources of variability, such as day-to-day, sampling or analytic variation.
We can overcome part of this variability by using averages of feeds from each farm or pile instead of using one sample or national average that may not be representative of the feed on a specific farm. Think again of our Chex Mix dilemma. Sampling more bags and averaging the value helps minimize the impact of counting errors, processing facility variability or any sources of variation we may see in pretzel count. More samples going into our averages give us increased confidence that the result is a representative value. All feeds that are fed at greater than 7% of the ration (on a dry-matter basis) should be sampled on a regular basis. This is roughly 4 pounds for a cow eating 55 pounds DM.
When we take each sample, practicing proper sampling techniques is essential. On-farm sampling has been shown to be a contributing factor to variability in many feedstuffs. For commodities and forages, multiple samples should be taken from each pile or bunk and blended into one subsample. These steps will help to define our feeds, with the goal of reducing variation where possible and managing natural variability.
For farms sampling their commodities on a routine basis, our laboratory has observed a drop in standard deviation compared to that of the national database. For example, while the standard deviation of starch nationwide is 3%, for one farm testing corn three times per week, the standard deviation dropped to 2% over the same period of time. This would decrease the expected range of starch delivered by corn grain versus actual by almost 0.25 pound per day.
As farms are challenged with regulatory issues and high commodity prices, the need to balance and feed more precisely is increasing. The advancements in ration-balancing models have also yielded more-precise insights into the nutrient requirements of cows to improve the level of precision feeding. Knowing the nutritive value of the available feeds will empower farms, and their nutritionists, to more precisely feed for the desired outcome. Although the idea of managing feed variability may seem a bit overwhelming, simple steps can be taken to help minimize the impacts of this variability – and improve precision feeding and feed management.