The USDA National Agricultural Statistics Service (NASS) released its semiannual Cattle report on Jan. 31. The total of all cattle and calves on Jan. 1, 2024, was estimated at 87.157 million head, about 1.7 million fewer than the previous year. This marks the fifth year of contraction for aggregate beef and dairy cattle inventories and the 10th year of the current cattle cycle – the cyclical expansion and contraction of the national cattle herd over time.
The cycle is influenced by the combined effects of cattle prices and input costs that drive cow-calf producer profitability, the gestation period for cattle, the time needed for raising calves to market weight and climate conditions.
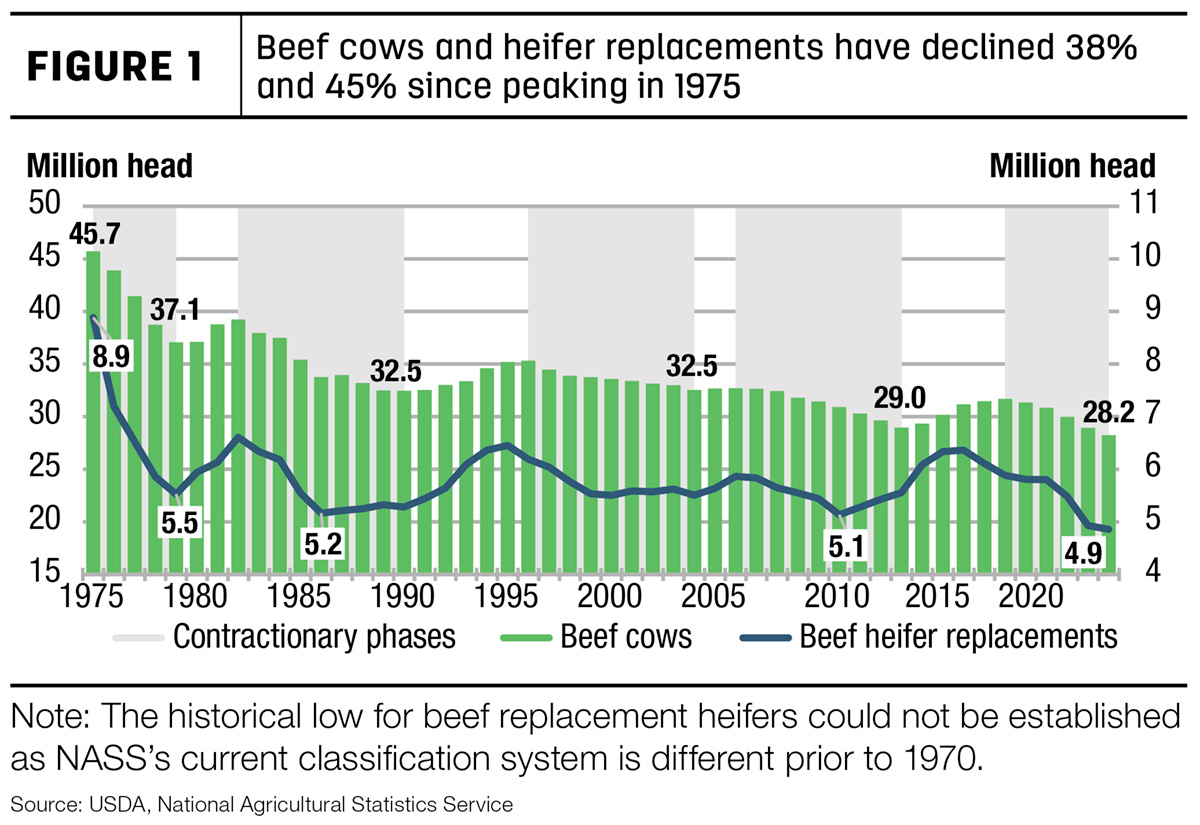
Beef cows, the largest class of cattle estimated in the Cattle report, are particularly affected by the factors affecting the cattle cycle and the subsequent driver of year-to-year changes in cattle inventory. Figure 1 shows that the Jan. 1 estimate of beef cows at 28.223 million head is down almost 2% from a year ago and that producers retained only 4.858 million beef heifers for addition to the beef cow herd, 1% less than last year.
For additional context, the total number of beef cows is down 38% from the historic peak set in 1975 of 45.712 million head and is the smallest inventory since 1961. As the number of beef heifers available for addition to the herd is correlated to the size of the beef cow herd, heifers also peaked in 1975 at 8.884 million head and have since fallen 45%.
Forage availability, as well as historically high prices for calves and cull cows, likely discouraged producers from retaining females in 2023. The culling rate of beef cows in 2023 was over 12% of the beef cow inventory on Jan. 1, 2023, the third-highest rate behind 2011 and 2022. In 2023, hay production was estimated to have improved based on a sizable increase in acres devoted to hay from 2022 to 2023. Most of the boost in acreage occurred in the Plains, and it translated into a 7% year-over-year increase in hay stocks on Dec. 1, 2023. However, hay stocks are still the third-lowest in the past 50 years.
The 2023 calf crop estimate was revised down from the July report to 33.593 million head, reflecting a 2.5% decline year over year. The lower calf crop contributed in part to the relatively low inventory of 13.285 million calves under 500 pounds on Jan. 1, 2024, down 373,300 head from 2023. Steers 500 pounds and over were estimated at 15.789 million head, down 267,300 head from 2023, and other heifers 500 pounds and over were estimated at 9.566 million head, down 192,000 head from 2023. It was further noted in the Cattle report that the number of cattle on feed in total feedlots was estimated at 14.423 million head, up 227,500 head from last year. As a result, there were 1.1 million head fewer feeder cattle year over year at 24.216 million head on Jan. 1, 2024, the lowest number to start the year since the series began in 1995. However, the category of other heifers 500 pounds and over that are not retained for cow replacements was estimated higher than previously expected and subsequently raises anticipation for more calves to be available to enter feedlots later this year.
Production outlook raised on higher weights in second-half 2024
The latest NASS Cattle on Feed report estimated Jan. 1 inventory of cattle in feedlots of 1,000 head or greater to be 11.93 million head, about 2% above 11.693 million head in the same month last year. Feedlot net placements in December were 5% lower year over year at 1.644 million head. Marketings in December were 1.725 million head, down almost 1% year over year. On Jan. 1, the number of cattle on feed over 150 days was up 13% above year-ago levels, based on a relatively strong pace of placements and a slower pace of marketings in late 2023.
The projection for 2024 beef production is raised 75 million pounds from last month to 26.185 billion pounds, which is 3% below 2023. From last month, there is a greater expected increase in steer and heifer marketings in late 2024, which is offset by fewer expected cows slaughtered. The increase in fed cattle marketings in the slaughter mix raised the outlook for average carcass weights in the second half of this year. This is primarily responsible for the bump in production from last month.
With the inclusion of official slaughter and production estimates for December 2023, beef production in 2023 is estimated at 26.963 billion pounds, down almost 5% from 2022. The decline in production was driven by 4% fewer cattle slaughtered and a slight decline in average carcass weights from the prior year.
Cattle prices raised on price strength
In January, the weighted average price for feeder steers weighing 750-800 pounds at the Oklahoma City National Stockyards was $225.99 per hundredweight (cwt), a $5.26 increase from December and almost $48 above January 2022. This also set a record for the month at $10 above the previous record set in 2015. In the first sale of February, feeder steers averaged $239.14 per cwt, an increase of $5 from the last week of January and nearly $52 above the same week last year.
Despite higher-than-expected estimates of "other heifers" on Jan. 1, supplies of cattle available for placement in 2024 remain tight. Based on current prices and a decline in expected feed prices from last month, an increase in feeder cattle prices is anticipated. As a result, the price outlook for each quarter was raised for an annual forecast of $249 per cwt, an increase of almost 14% from 2023.
The January average price for fed steers in the 5-area marketing region was $174.45 per cwt, $3.76 higher than December and over $18 above January 2022. In the first week of February, prices averaged $177.79 per cwt, more than $19 above the same week last year. Based on recent price data, the 2024 price forecast is adjusted slightly higher from last month, with the annual price projected at $180 per cwt, over 2% above 2023.
Beef trade deficit in 2023 and anticipated in 2024
Trade data for December 2023 was recently released, closing out a contractionary year of the cattle cycle where, as expected, exports fell and imports rose. This created a trade deficit by volume (imports larger than exports) for the first time since 2020. Figure 2 shows the reversal of the trade balance from the last two years. Given much smaller production and continued strong domestic demand for beef, the trade deficit is expected to widen in 2024.
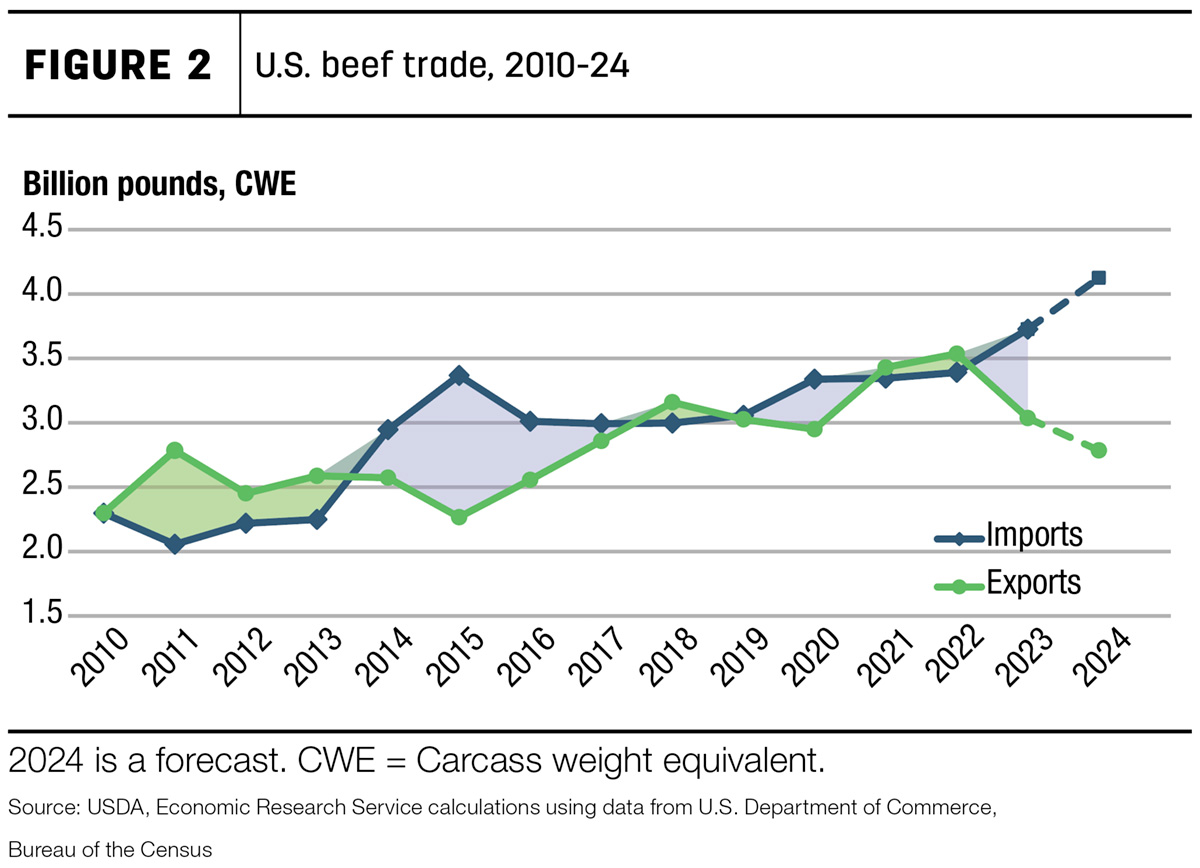
The trade deficit in 2023 shown in Figure 2 is based on volumes. The U.S. is well known as both a major global exporter and importer of beef due to exporting high-quality product and importing large amounts of lower-value processing-grade trimmings for blending into hamburgers. This is evidenced (despite the differences in volume) by the annual value of U.S. beef exports in 2023 – over $9.3 billion, while the value of imports was just under $9 billion. Therefore, from a value perspective, there was a trade surplus of more than $350 million.
Looking back at 2023, the total volume of exports was 3.038 billion pounds, a year-over-year decrease of 14%. South Korea was the top market for U.S. beef exports with a share of 22%, though shipments to the country fell 17% year over year. Exports to Japan, the leading market for U.S. beef for the last decade, decreased 22% year over year, resulting in a 21% share of total U.S. exports for the year. Exports to China fell 20% year over year. Of the top six markets, only exports to Mexico showed a year-over-year increase, up 12%, and exports to Canada only declined 2% for the year. As a result, the share of exports to our North American neighbors combined increased 3% over 2022, while the share of exports to the top Asian markets combined fell 3%.
On the import side, total imports reached a record 3.727 billion pounds, a year-over-year increase of nearly 10%. Driving this increase were imports from Australia and New Zealand, up 66% and 33%, respectively. Canada was again the top supplier of beef to the U.S., accounting for 27% of imports. Australia jumped back up to the No. 2 spot this year, increasing to a share of 18% of U.S. imports. Imports from Mexico, the third largest supplier in 2023, showed a 12% decrease, with the share of total imports falling to 17%. New Zealand and Brazil rounded out the top five suppliers, with shares of 14% and 12%, respectively.
Imports from Brazil reshape historical seasonal trends
U.S.-bound beef exports from Brazil have grown rapidly over the past three years and have shifted the seasonal expectations for U.S. beef imports. In February 2020, the USDA Food Safety and Inspection Service lifted restrictions on beef imports from Brazil. The growth in exports from Brazil to the U.S. escalated in late 2021 when China placed a three-month embargo on beef from Brazil, causing some of Brazil’s beef to be redirected to the U.S. After the embargo ended, the elevated level of exports to the U.S. was not sustained throughout 2022, especially since fresh beef from Brazil is subject to a tariff rate quota in the U.S. Once the quota is filled, imports of fresh beef from Brazil are subject to a higher tariff. In April 2022, the quota was filled, making the U.S. a less attractive market and causing imports to fall in the following months.
This pattern was repeated in both 2022 and 2023 as shipments from Brazil increased in the later part of the year, sending beef to arrive in the U.S. on Jan. 1, when the quota reopens. The 2023 quota was filled by May; this year, as of Jan. 29, the 2024 quota was already more than 71% filled according to the U.S. Customs and Border Protection Commodity Status Report. This new dynamic has changed the seasonality expectation for U.S. beef imports. Where imports were historically strongest during the second or third quarter, the quarterly forecasts for beef imports in 2024 reflect this new seasonal pattern, with much higher imports expected in the first quarter (see Figure 3).
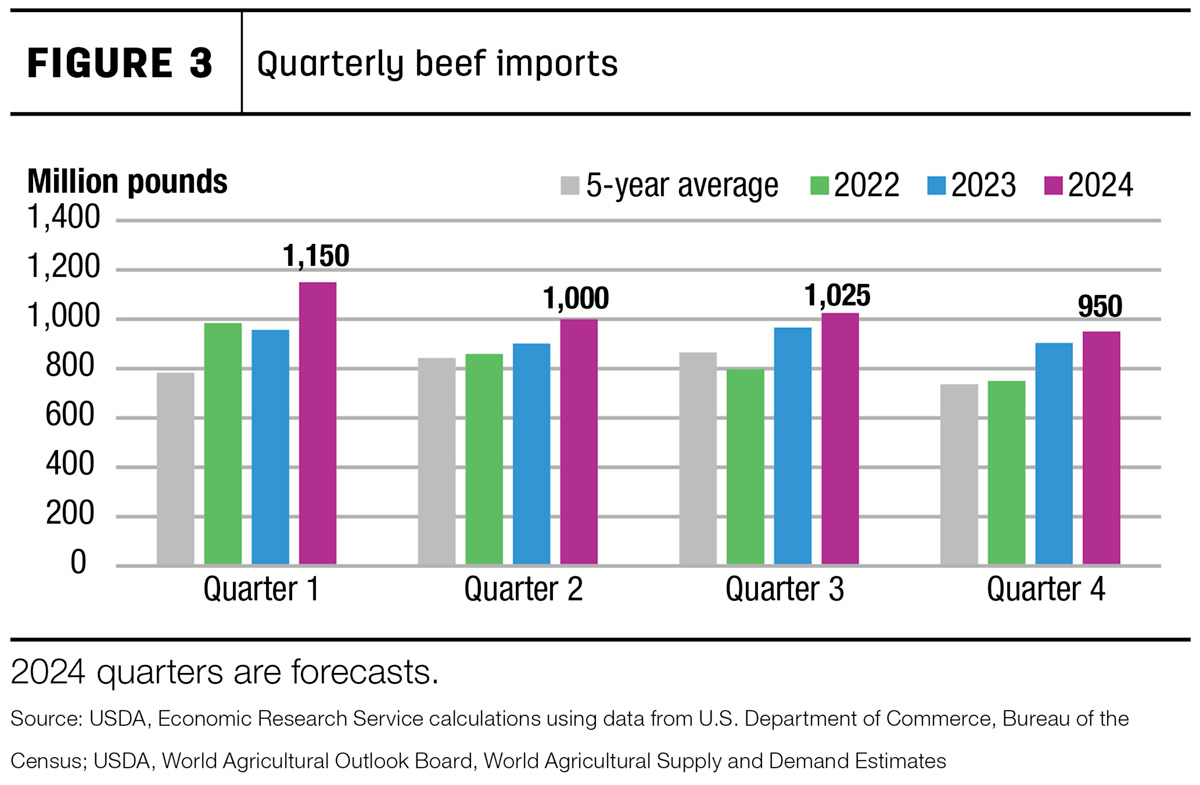
Brazilian beef is very price competitive compared to that of other import suppliers. Even after accounting for both the in-quota and out-of-quota tariffs in 2023, the unit value of imports of fresh and frozen beef from Brazil was significantly lower than other top suppliers. The unit values of beef from Australia and New Zealand have been decreasing as well. Domestic demand for processing-grade beef, combined with increased supplies from Oceania and South America, drive the import forecasts higher this month. The annual import forecast for 2024 is raised to 4.125 billion pounds, which if realized would be an 11% increase over 2023. The quarterly breakout of the forecast is shown in Figure 3.