


The profit margin landscape has deteriorated for dairy producers since our last update in the spring as forward milk prices have declined more than feed costs, thus limiting projected profitability looking out to 2014.

While margins remain positive, projected profitability is now much tighter than previously forecast in the first half of 2014, and it will be important for dairies to take this into consideration when evaluating their marketing plans for next year.
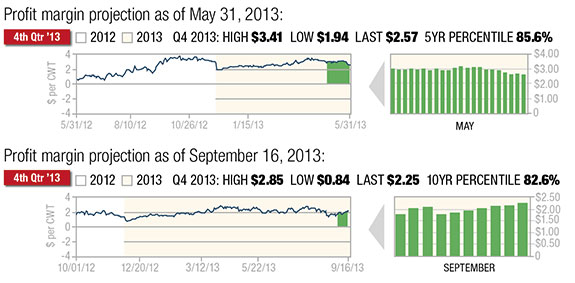
From both an absolute and relative basis, the best opportunity currently is being projected in nearby Q4, where the margin is estimated at $2.25 per hundredweight (cwt) for our model dairy â at the 82nd percentile of the previous 10 years.
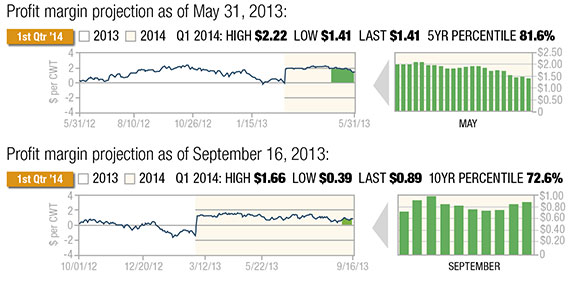
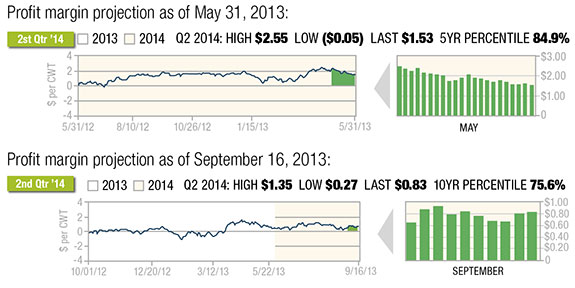
Beyond that, margins are projected below $1 per cwt for the first half of 2014, though still at levels above the 70th percentile of the previous 10 years.
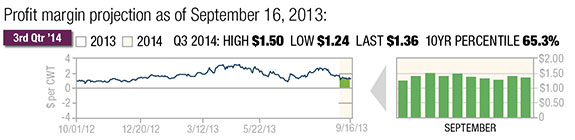
While the third quarter of 2014 is projecting a positive margin of $1.36 per cwt, it represents only the 65th percentile of the past 10 years.
The figures reflect both the current outlook for dairy margins through the third quarter of 2014 as well as comparison figures to these same forward profit margin projections back in May.
As we move into the final quarter of the calendar year, the main positive feature for dairy producers is the lower feed costs that are anticipated, at least insofar as corn prices are concerned.
While alfalfa hay availability and price may still represent a challenge for many dairies to contend with, much of the cost of the projected feed ration is expected to decline as a function of the stronger corn harvest this season compared to last.
The USDA recently released their September WASDE report, updating the projections for corn yield, production and ending stocks.
While on average, analysts were expecting the government to lower the yield forecast due to the lack of rainfall combined with hotter temperatures throughout August, the USDA instead increased it 0.9 bushels to 155.3 bushels per acre.
Following this adjustment, production increased by 80 million bushels to 13.843 billion, and ending stocks were pegged up 18 million bushels from August to 1.855 billion.
These stocks relative to projected usage at 14.6 percent represents a much more comfortable supply-demand balance compared to the 5.9 percent stocks-to-use ratio coming off the last crop year.
Although the futures price response has been somewhat muted since the release of the report, the market is within $0.10 of contract lows as of this writing, and the onset of harvest with new-crop supply availability may apply more pressure over the medium term barring any significant change to harvested acreage that may be revealed in updated FSA data.
The recent balance sheet changes were not quite as positive for the soybean complex relative to corn.
Fortunately, protein represents a much smaller component of the average dairyâs feed ration, but the bad news is that dairy producers should probably not expect much price relief here.
The USDA lowered the soybean yield forecast 1.4 bushels from August to 41.2 bushels per acre, which dropped the production forecast by 106 million bushels to 3.149 billion.
While the less-beneficial August weather was expected to have a more detrimental effect on soybean crop conditions compared to corn, it was feared that the yield and production figures may have dropped further than what the USDA indicated.
Their projections were more or less in line with trade expectations; however, with ending stocks projected down 70 million bushels from August to 150 million, the new-crop stocks-to-use ratio at 4.8 percent is not much larger than the 4 percent ratio it replaces in the previous crop year.
On a positive note, the world balance sheet reflects expectations for much larger soybean crop production out of South America, which means there will be less demand for soybean meal exports this season, thus freeing up more supply to be consumed in the domestic market.
Also positive outside of the U.S. is the recovery in Canadian canola production, which will apply pressure on canola meal prices relative to soy.
Milk prices, meanwhile, have come under heavy pressure since May, responding perhaps in part to expectations for increased milk production to begin coming to market from the relief of lower feed costs.
As prices first began declining over the summer, it was evident that the pace of dairy cow slaughter had slowed down.
June dairy cow slaughter was 8.3 percent lower than May on a daily average basis and down 3.9 percent from 2012. By contrast, dairy cow slaughter has been up 3.4 percent from 2012 through the first half of the year.
While the current cost of heifer replacement relative to cull cow revenue might suggest dairy cow slaughter may increase heading into the fall, negative profit margins no longer appear to be a motivating factor in culling the dairy herd.
One feature that has been evident recently is the strength of Class IV milk futures prices relative to that of Class III. As an example, Class IV futures currently command a premium in excess of $2 per cwt in the Q4 October, November and December futures.
This is historically quite high, and should this relationship hold over the next few months, it would portend very positive producer price differentials for those dairies on the Federal Milk Marketing Order.
Similarly, for those dairies with operations in California, the projected overbase price would currently be quite attractive given the spread of Class IV over Class III. This likewise would add to the positive nearby margins currently being projected in fourth quarter, holding everything else constant.
Many readers may wonder how we derive our profit margin projection.
The model we reference in the figures derives a margin calculation that assumes, using a feed-price correlation model, that for a typical dairy 62.4 pounds of corn (or equivalent) and 7.34 pounds of meal (or equivalent) are required to produce 100 pounds of milk (including feed required for dry cows but excluding heifers not yet fresh).
In addition, other assumed costs include $0.90 per cwt for other, non-correlating feeds, $2.65 per cwt for corn and meal basis, and $7 per cwt for non-feed expenses. Also, milk basis is assumed at $0.75 per cwt, and non-milk revenue is assumed at $1 per cwt.
For any individual dairy, these assumed costs, revenues and basis levels may be above or below what we are using in our model. It is important to understand the specifics of your own dairy and model your operation accordingly to produce the most accurate profit margin projection for your business.
This is particularly true for determining your marketing plan and contracting alternatives, as relative profitability will direct dairies to different strategies depending on their specific profit margins.
Another question we commonly hear is how to read or interpret the figures. The last reading indicates the profit margin calculation as of a particular date, expressed in dollars per cwt.
The figure references where the profit margin for that particular period has been since we first began tracking it, with the high and low values reflecting the range of that margin projection since the tracking began.
As an example, the profit margin projection for Q4 at $2.25 per cwt is reflecting values for the current fourth-quarter period, referencing October, November and December Class III milk futures against feed costs referencing December corn and soybean meal futures against the other aforementioned fixed-cost and revenue assumptions.
The 10-year percentile, in this case 82.6 percent, means that the current margin projection of $2.25 per cwt has been stronger during the fourth quarter about 17.4 percent of the time during the previous 10 years and weaker than that about 82.6 percent of the time.
This helps us put a numerical value within an objective context as $2 per cwt may mean entirely different things in the fourth quarter versus the second quarter, for example.
It may be wise for instance to begin protecting profitability at a lower absolute level in a particular marketing period because the relative percentile for that period is currently at a high level. PD
Chip Whalen is a senior risk manager and director of education for Commodity & Ingredient Hedging based in Chicago, Illinois. He can be reached by email .

Chip Whalen
Vice-President Education and Research
CIH â Commodities & Ingredient Hedging LLC


