


The U.S. average all-milk price rose $1.30 per hundredweight (cwt) in July, equalling the 2016 high set in January, according to the USDA NASS Ag Prices report, released Aug. 31.

USDA estimated the July 2016 U.S. average all-milk price at $16.10 per cwt, still 50 cents less than July 2015’s average of $16.60 per cwt (Table 1).
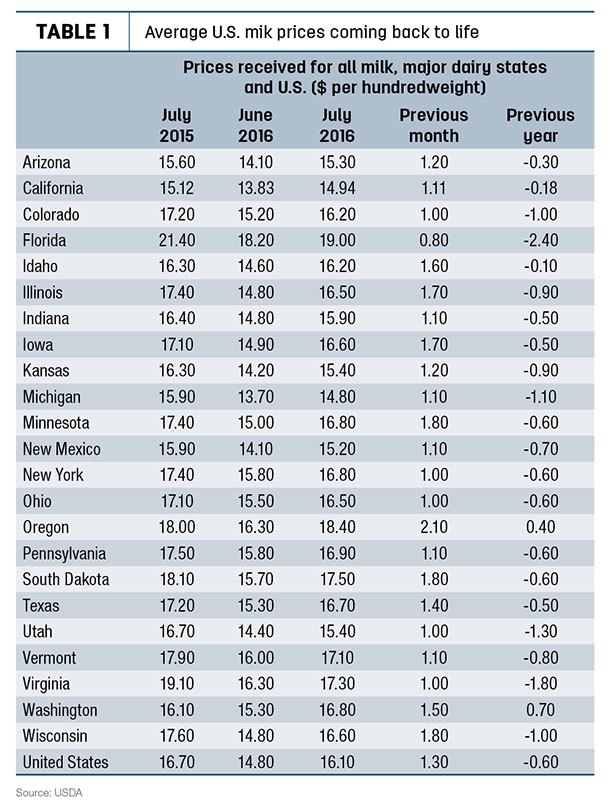
Oregon posted the largest month-to-month increase, up $2.10 per cwt compared to June’s price, followed by Minnesota, South Dakota and Wisconsin, each up $1.80 from the month before.
Florida posted the smallest monthly gain, up 80 cents per cwt, but still had the highest average price for July, at $19 per cwt.
Compared to a year earlier, price gaps have begun to close, and producers in Oregon and Washington actually saw higher prices compared to July 2015.
Through the first seven months of 2016, U.S. prices averaged $15.36 per cwt, about $1.49 (9 percent) less than the same period a year earlier.
August FMMO Class III price continues climb
The federal milk marketing order (FMMO) Class III minimum price continued to rally in August, but the Class IV price was pressured lower by declining butter prices.
The August Class III price rose $1.67 from July, and is the highest since December 2014. The Class III price has gained more than $4 per cwt since May.
The Class IV price fell 19 cents from July, but remains $1.75 more than a year ago.
FMMO Class III ($ per cwt)
August 2016 – $16.91
July 2016 – $15.24
August 2015 – $16.27
January-August 2016 – $14.13
January-August 2015 – $16.07
FMMO Class IV ($ per cwt)
August 2016 – $14.65
July 2016 – $14.84
August 2015 – $12.90
January-August 2016 – $13.57
January-August 2015 – $13.53
Source: USDA Ag Marketing Service
California August Class 4a/4b milk prices announced
California's August 2016 Class 4a/4b milk prices were announced Sept. 1. Class 4b increased from July, and is the highest since November 2014. August’s Class 4a price declined.
California Class 4a ($ per cwt)
August 2016 – $13.99
July 2016 – $14.23
August 2015 – $13.08
January-August 2016 – $13.22
January-August 2015 – $13.38
California Class 4b ($ per cwt)
August 2016 – $16.34
July 2016 – $14.67
August 2015 – $15.74
January-August 2016 – $13.44
January-August 2015 – $14.58
Source: California Department of Food and Agriculture
Trade outlook: U.S. dairy export expectations reduced
USDA reduced fiscal year 2016 (FY’16) U.S. dairy product export projections further, forecasting values to be down nearly $1 billion from a year earlier. However, in their first look at FY’17, USDA economists said dairy product exports are expected to rebound somewhat.
FY’16 (Oct. 1, 2015, through Sept. 30, 2016) dairy exports are expected to dip to $4.5 billion, $200 million less than May’s quarterly Ag Trade Outlook report. After a record high of $7.4 billion in FY’14, FY’15 U.S. dairy product exports fell 25 percent, to $5.5 billion.
As in FY’15, the weaker U.S. export values are attributed to strong competition in an oversupplied market. U.S. cheese, nonfat dry milk and whey face strong competition and prices remain low.
In its initial FY’17 forecast, USDA said dairy export values would increase to about $4.8 billion.
Meanwhile, the FY’16 U.S. dairy import forecast was estimated at $3.4 billion, down about $100 million from the May forecast, and compares to $3.5 billion in FY’15. FY’16 cheese imports are projected at $1.4 billion, compared to $1.3 billion in FY’15.
In its initial FY’17 forecast, USDA said dairy import values would decline to about $3.3 billion, with cheese imports steady at $1.4 billion.
The value of the U.S. dollar has fluctuated against other currencies in 2016, but is expected to appreciate on net, then show slight depreciation in 2017. The 2016 world GPD growth is expected to match 2015, but pick up in 2017.
Total FY’16 U.S. agricultural exports are forecast at $127 billion, nearly $13 billion less than FY’15 exports. U.S. agricultural imports are forecast at a record $113.1 billion, down $1.1 billion from February. The U.S. agricultural trade surplus is forecast at $13.9 billion, down from $25.5 billion in FY’15.
Conditions look to improve next year. Total FY’17 U.S. agricultural exports are forecast at $133 billion, up $6 billion from FY’16. U.S. agricultural imports are forecast to remain fairly steady, at $113.5 billion. As a result, the U.S. agricultural trade surplus is forecast at $19.5 billion.
Read also:
Cheese, milk futures prices drop following USDA cheese purchase announcement
Milk production and product inventories cool prices
Margins rising, but use risk management tools to build a floor
July MPP-Dairy margin improves ![]()

-
Dave Natzke
- Editor
- Progressive Dairyman
- Email Dave Natzke


