Our firm has prepared and issued averages of our dairy clients’ income and expense reports on a quarterly basis for many years. We have done this for the purpose of providing comparable industry standards to benefit our clients and others working in the dairy industry.

These reports have proven to be very useful tools to determine where a dairy’s particular strengths and weaknesses lie.
This month we are introducing our latest tool, the National Dairy Advanced Index, to benefit dairymen and those dairy-related industries. This is an attempt to provide more timely feedback on the current economic conditions dairies are experiencing. We anticipate this information will highlight the major trends in milk pricing, feed costs, labor prices and many other areas of farm operations.
We will be producing this index within 75 days of the end of the quarter in order to make the information as useful as possible, to as many as possible, in as timely a manner as possible. We will still prepare our traditional averages with breakouts of the different geographical segments as we always have, but we felt there was a need for a more comprehensive look at the status of the milk production business from a national perspective.
The index is the average of data from 45 dairies from a total of 13 different states. To the extent possible, the individual operations making up the index will remain the same from one quarter to the next and from one year to another.
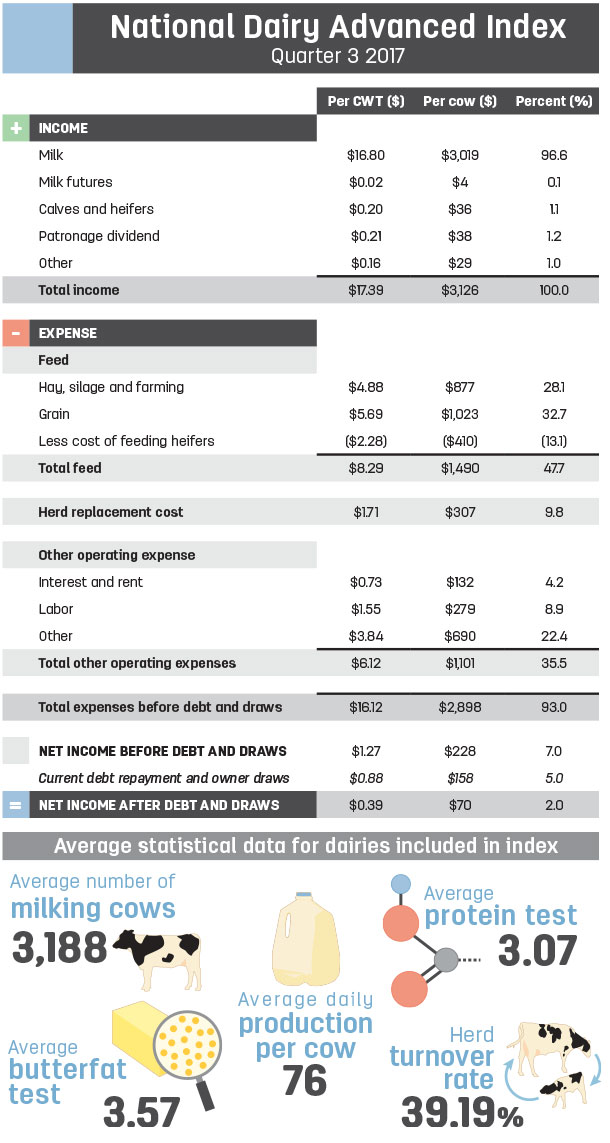
This is intended to follow along the lines of the Dow Jones Industrial index which follows the collective stock prices of the same companies over a long period of time. The particular mix of dairies included in the index average about 3,200 milking cows and produce about 76 pounds of milk per cow per day.
The first index reveals:
- A profitable first nine months of 2017, although the margin is relatively thin.
- Net income (before owner draws) amounts to $1.27 per hundredweight (cwt) of milk and $228 per cow.
- Feed costs are still more than $8 per cwt, although feed costs have dropped considerably from the record-high levels of three or four years ago when the index would have been around $10 per cwt. Managing feed costs is still the quickest way to impact a dairy’s bottom line, whether positively or negatively.
- Labor costs have risen above $1.50 per cwt, which represents a substantial increase over prior years’ costs. The escalation is expected to continue, especially in states like California where the minimum wage will increase $1 per hour in January 2018 and again every year until it hits $15 per hour.
- Herd replacement costs for many years averaged around $1.20 per cwt until beef prices escalated dramatically in 2014 and 2015, which decreased these costs to about $1 per cwt or even less in some cases. Now, they have risen to $1.71 per cwt on average.
- Total cost of production (before owner’s draw) averages $16.12 per cwt for the dairies in the index.
- If this average cost stays level into 2018, most dairies will be losing money next year based on the prices reflected in futures markets.

If you have any comments or reflections on the index or any other aspect of this article, please contact the author through the website (Genske, Mulder & Company).
Quarter 3 2017
Click here or on the image above to view it a t full size in a new window.