The first week of February brought near- to above-normal precipitation from the interior Southeast into New England, but dryness intensified across the southern half of the Plains and much of the Southwest. Drought continued to expand on the Southern Plains.

Drought area largest since May 2013
The USDA’s World Agricultural Outlook Board estimated 40 percent of U.S. hay-producing acreage was located in areas experiencing drought as of Feb. 8 (Figure 1).
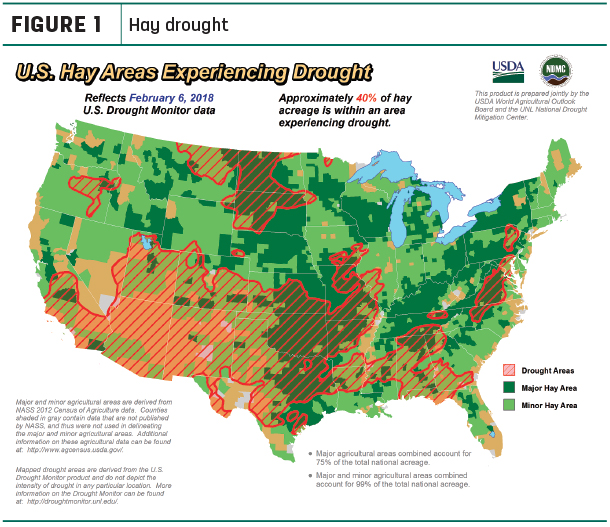
That’s the highest percentage of U.S. hay area under drought conditions dating back to May 2013. In addition, about 32 percent of alfalfa hay acreage was considered under drought conditions (Figure 2).
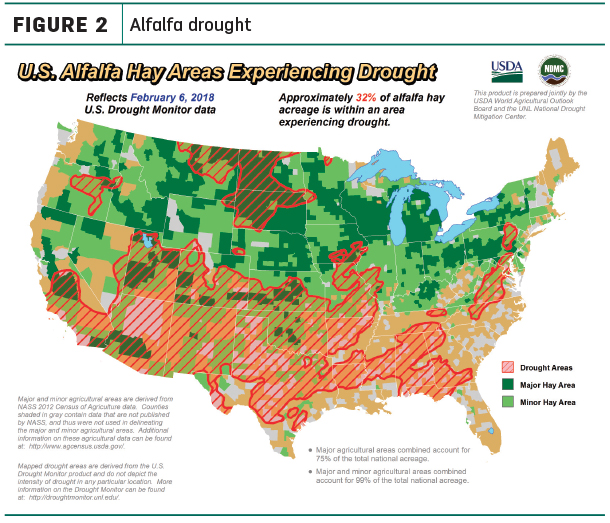
Check out the hay areas under drought conditions.
Western snowpack, water supply updates
The situation across the western U.S. presented sharply diverging scenarios, with good season-to-date moisture supplies across the northern Rockies and Pacific Northwest, in sharp contrast to intensifying drought and a lack of vital snowpacks across central and southern portions of the Rockies and Sierra Nevada.
According to recent snowpack and water supply outlook reports:
- As of late January, Arizona’s snowpack and snow water equivalents levels were well below normal throughout the major basins.
- Last year, California rebounded from its most severe drought on record. However, warm, dry conditions have returned, with below-average precipitation and little snowpack in the Sierras. Precipitation totals across the state are less than 50 percent of average to date. California’s Department of Water Resources estimated statewide snow water equivalents 4 inches, or less than 25 percent of normal on Feb. 8.
- Southern Colorado has remained abnormally dry and continues to hold well below normal snowpack. Statewide, mountain precipitation in January was 70 percent of average, with the South Platte receiving the most at 85 percent and the Upper Rio Grande the least at 50 percent of average. The good news is: Every major basin in Colorado is still maintaining above-average reservoir storage volumes.
- Idaho’s snowpack is similar to a month ago, with the highest percentages in the Panhandle, the basins bordering Montana and along the Continental Divide. The lowest snowpacks are in the lower-elevation watersheds in southern Idaho. January precipitation patterns across the state mirrored the patterns seen in October and December.
- In Montana, early season snowfall has left all basins across the state at normal to well-above normal and, if the current weather patterns persists through the spring, the water supply should be near to above average.
- Nevada’s 2018 snowpack and precipitation story line continue to be depressing, but there is some good news regarding storage in the northern reservoir, where storage is excellent and offers a buffer against drought.
Many reservoirs are at their flood control capacity for this time of year, meaning water managers are storing as much water as legally possible. Snowpack percentages have continued a gradual decline and are now in the realm of recent drought years like 2012, 2014 and 2015.
- January did little to improve conditions, and New Mexico is setting record-low levels for both precipitation and snowpack; 100 percent of the state is in some category of drought.
- An overall warm and dry winter has left Oregon snowpack conditions well below normal. A significant storm cycle moved through the state during the last week of January, but temperatures turned warm, causing snowmelt at some of the lower elevations. As of Feb. 1, 17 long-term monitoring sites in Oregon are recording their second- or third-lowest snowpacks on record. The northern tier of Oregon is faring slightly better in the snowpack department.
- Utah did not see the January moisture levels it had hoped for, and most snowpacks in the basins south of Provo fall within the worst five years on record. Statewide, Feb. 1 snowpacks were all below normal. One bright point is: The statewide average reservoir storage is at 73 percent capacity compared to 53 percent last year.
- Washington has managed to hold on to a respectable snowpack throughout most of the state, with conditions better in the north. Snowpack along the east slopes of the Cascade Mountains, including the Yakima area, were at 95 percent of normal.
- Conditions were better in most of Wyoming, where precipitation and snow water equivalents as of Feb. 1 were mostly at or above normal.
Alfalfa exports set record
Alfalfa hay exports finished the year strong. December shipments of 218,160 metric tons (MT) were the highest monthly volume since June, pushing 2017 total alfalfa hay export sales to a record-high 2.66 million MT.
China was the main driver of alfalfa hay exports in 2017, taking 44 percent of the year’s total.
On the other hand, export sales of other hay totaled 117,703 MT in December, the lowest total since May. Weaker sales to the two leading markets, Japan and South Korea, accounted for most of the shrinkage. Nonetheless, 2017 total other hay exports topped 1.534 million MT, the highest total in three years.
Alfalfa hay prices
The latest available USDA monthly Ag Prices report was released Jan. 30, summarizing December 2017 prices.
Alfalfa
The December 2017 U.S. average price paid to alfalfa hay producers at the farm level was $148 per ton, unchanged from November but $21 more than a year earlier. Despite the steady national average, a few states reported lower prices, impacting regional averages (Figure 3).
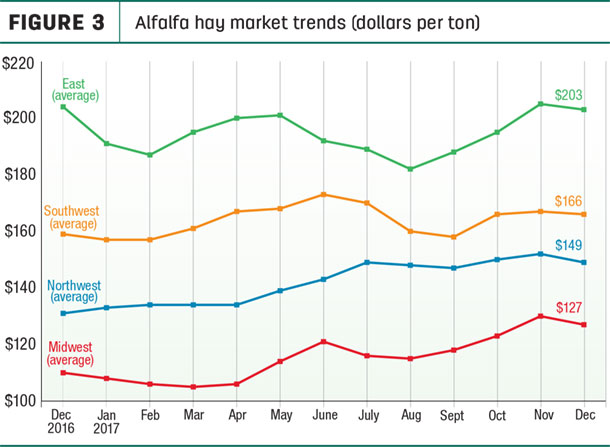 Compared to a month earlier, December average alfalfa hay prices were up $20 per ton in Michigan, with smaller increases noted in Illinois, Nebraska and Texas. In contrast, prices were down $10 to $20 per ton in Iowa, Minnesota, New Mexico, North Dakota, Oregon and Wisconsin.
There was greater disparity in price changes from a year earlier. December 2017 prices for alfalfa hay were up $41 in Kansas, $35 per ton in California and $33 per ton in Wisconsin.
Prices rose $20 to $30 per ton in Arizona, Colorado, Michigan, Minnesota, Nevada, Oregon, South Dakota, Washington and Wyoming. In contrast, Oklahoma saw a $40 drop in the year-to-year average alfalfa hay price, and prices were down $9 to $15 per ton in Illinois, Kentucky, Missouri and Pennsylvania.
Highest alfalfa hay prices were in New York ($235 per ton) and Kentucky ($205 per ton); lowest prices were in North Dakota ($90 per ton) and Nebraska ($94 per ton).
Other hay
The December 2017 U.S. average price for other hay was estimated at $118 per ton, unchanged from November and just $1 per ton more than December 2016.
Regional averages were mixed (Figure 4), slightly higher in the East and Southwest but lower in the Midwest and Northwest. Iowa and Oregon producers saw December average other hay prices drop $20 per ton from November, with North Dakota and Wisconsin prices down $11 and $9 per ton, respectively.
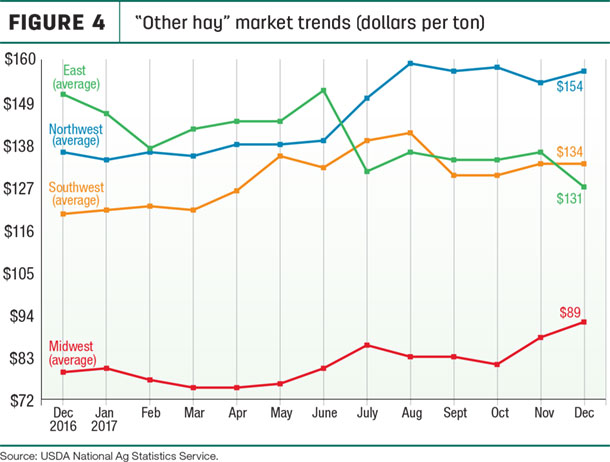
Offsetting those declines were increases of $5 to $10 per ton in California, Illinois, Kentucky, Michigan and Pennsylvania.
Individual state price changes from a year earlier were more notable. December 2017 prices for other hay were up $40 per ton in Washington and $35 per ton in Nevada, and $20 to $7 per ton in Arizona, Colorado, Michigan, Minnesota, New Mexico, Oregon, Wisconsin and Wyoming. In contrast, New York saw a $56 drop in the year-to-year average alfalfa hay price.
Figures and charts
The prices and information in Figure 1 (alfalfa hay market trends) and Figure 2 (“other hay” market trends) are provided by NASS and reflect general price trends and movements. Hay quality, however, was not provided in the NASS reports. For purposes of this report, states that provided data to NASS were divided into the following regions:
- Southwest – Arizona, California, Nevada, New Mexico, Oklahoma, Texas
- East – Kentucky, New York, Ohio, Pennsylvania
- Northwest – Colorado, Idaho, Montana, Oregon, Utah, Washington, Wyoming
- Midwest – Illinois, Iowa, Kansas, Michigan, Minnesota, Missouri, Nebraska, North Dakota, South Dakota, Wisconsin
Organic hay
The USDA’s Organic Hay report, released Jan. 31, reported grower FOB farm-gate organic hay prices as follows: Supreme alfalfa large square bales – $300 per ton, Premium alfalfa large square bales – $270 to $280 per ton, Good alfalfa large square bales – $265 per ton and Premium mid-size square bales – $310 per ton. No prices were reported for delivered hay.
National organic grains and feedstuffs report
Dairy outlook: Cow numbers rising, milk prices aren’t
December 2017 U.S. milk production turned in another modest increase, up just 1.1 percent compared to the same month a year earlier. However, despite a couple of months of small growth in the U.S. production, milk output around the globe continues to climb, and 2018 milk prices were projected even lower – to levels similar to 2016.
Economic pressures aside, the size of the U.S. dairy herd is expected to grow in 2018. The USDA’s semi-annual cattle report, released in late January, estimated there were nearly 9.4 million cows in U.S. herds as of Jan. 1, the highest January total in two decades.
And there are about 4.8 million dairy replacement heifers waiting in the wings, or about 50.9 heifers per 100 cows, about the same as the year before. Combined, cow and heifers numbers were up 80,100 compared to a year ago.
Beef outlook: First-quarter prices still looks the strongest
The USDA’s 2018 beef production forecast lowered the estimated number of cattle placed on feed in the first part of 2018, resulting in lower marketings and beef production in the second half of the year. However, the USDA still projects 2018 cattle price will be down slightly from 2017, with strongest prices in the first quarter of the year.
The USDA semi-annual cattle report, released Jan. 31, estimated the U.S. cattle inventory continued to increase for the fourth consecutive year, but the report also indicated that fewer numbers of cattle were being held outside feedlots.
Fuel prices higher
The U.S. Energy Information Administration (EIA) estimated U.S. retail prices for regular gasoline averaged about $2.64 per gallon during the first week of February, up 3 cents from the week before and 34 cents per gallon more than a year ago.
West Coast prices increased nearly 6 cents to $3.15 per gallon; East Coast and Midwest prices each increased nearly 3 cents to $2.61 per gallon and $2.54 per gallon, respectively; Gulf Coast prices increased 2 cents to $2.37 per gallon; and Rocky Mountain prices increased about 1 cent to nearly $2.50 per gallon.
U.S. on-highway diesel fuel prices averaged about $3.09 per gallon, up 1.6 cents from a week earlier and 53 cents per gallon more than a year ago. West Coast prices rose nearly 3 cents, to $3.46 per gallon; East Coast prices rose 2 cents to $3.13 per gallon; Midwest and Rocky Mountain prices each increased over 1 cent to $3.04 per gallon and $2.98 per gallon, respectively; and Gulf Coast prices increased less than 1 cent, remaining at $2.87 per gallon.
EIA estimates total U.S. crude oil production averaged 9.3 million barrels per day in 2017 and will average 10.6 million barrels per day in 2018, which would mark the highest annual average U.S. crude oil production level ever. Despite the higher U.S. production, EIA forecast crude oil prices will rise, averaging about $62 per barrel in both 2018 and 2019, compared with $54 per barrel in 2017. Relatively little production growth is expected from members of the Organization of the Petroleum Exporting Countries (OPEC).
Coming up
The USDA will issue its Prospective Plantings report on March 29, estimating potential alfalfa and other hay acreage for 2018. ![]()

-
Dave Natzke
- Editor
- Progressive Dairyman
- Email Dave Natzke